On 24 August, an earthquake struck central Italy, claiming at least 290 lives and causing widespread damage. Satellite images are being used to help emergency aid organisations, while scientists have begun to analyse ground movement.
The Italian peninsula is prone to earthquakes owing to the fault lines created by the separation of the African and Eurasian tectonic plates. The fault line separating these two plates runs below the central Apennine mountains and along Italy’s Adriatic coast.
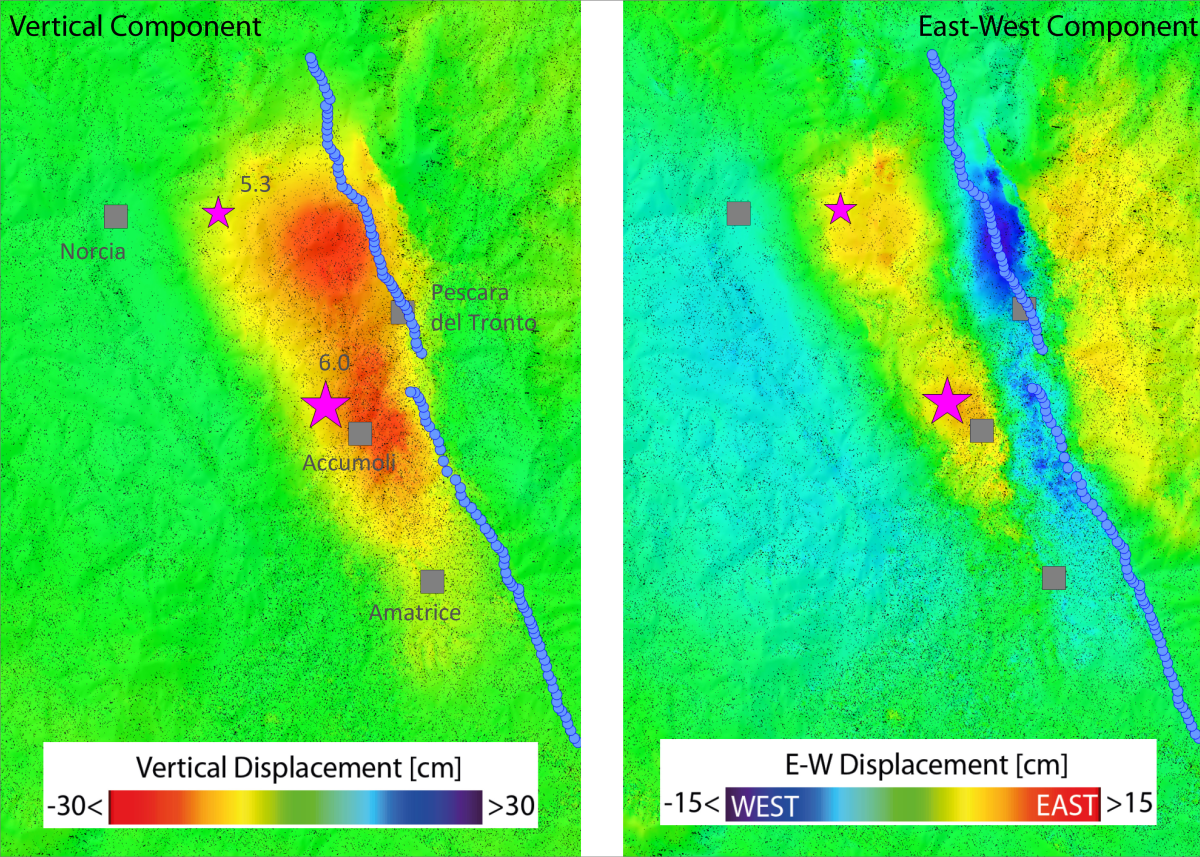
Figure 1: Ground displacement from Italy’s earthquake: Scientists from Italy’s Institute for Electromagnetic Sensing of the Environment combined Sentinel-1 radar acquisitions over central Italy from before and after the 24 August 2016 earthquake: 15 August, 21 August and 27 August 2016. The result shows vertical ground subsidence, reaching about 20 cm in correspondence to the Accumoli area, and lateral movement of up to 16 cm. The blue line indicates the location of the fault trace. [Contains modified Copernicus Sentinel data (2016)/ESA/CNR-IREA]
Under the coordination of the Italian Department of Civil Protection, scientists from Italy’s National Institute for Geophysics and Volcanology and the Institute for Electromagnetic Sensing of the Environment of the National Research Council are studying data from the Sentinel-1 satellite mission and other space borne radar missions to map surface deformations caused by the earthquake.
The team found that the main deformation pattern shows subsidence reaching about 20 cm in the Accumoli area, and sideways movement of up to 16 cm.
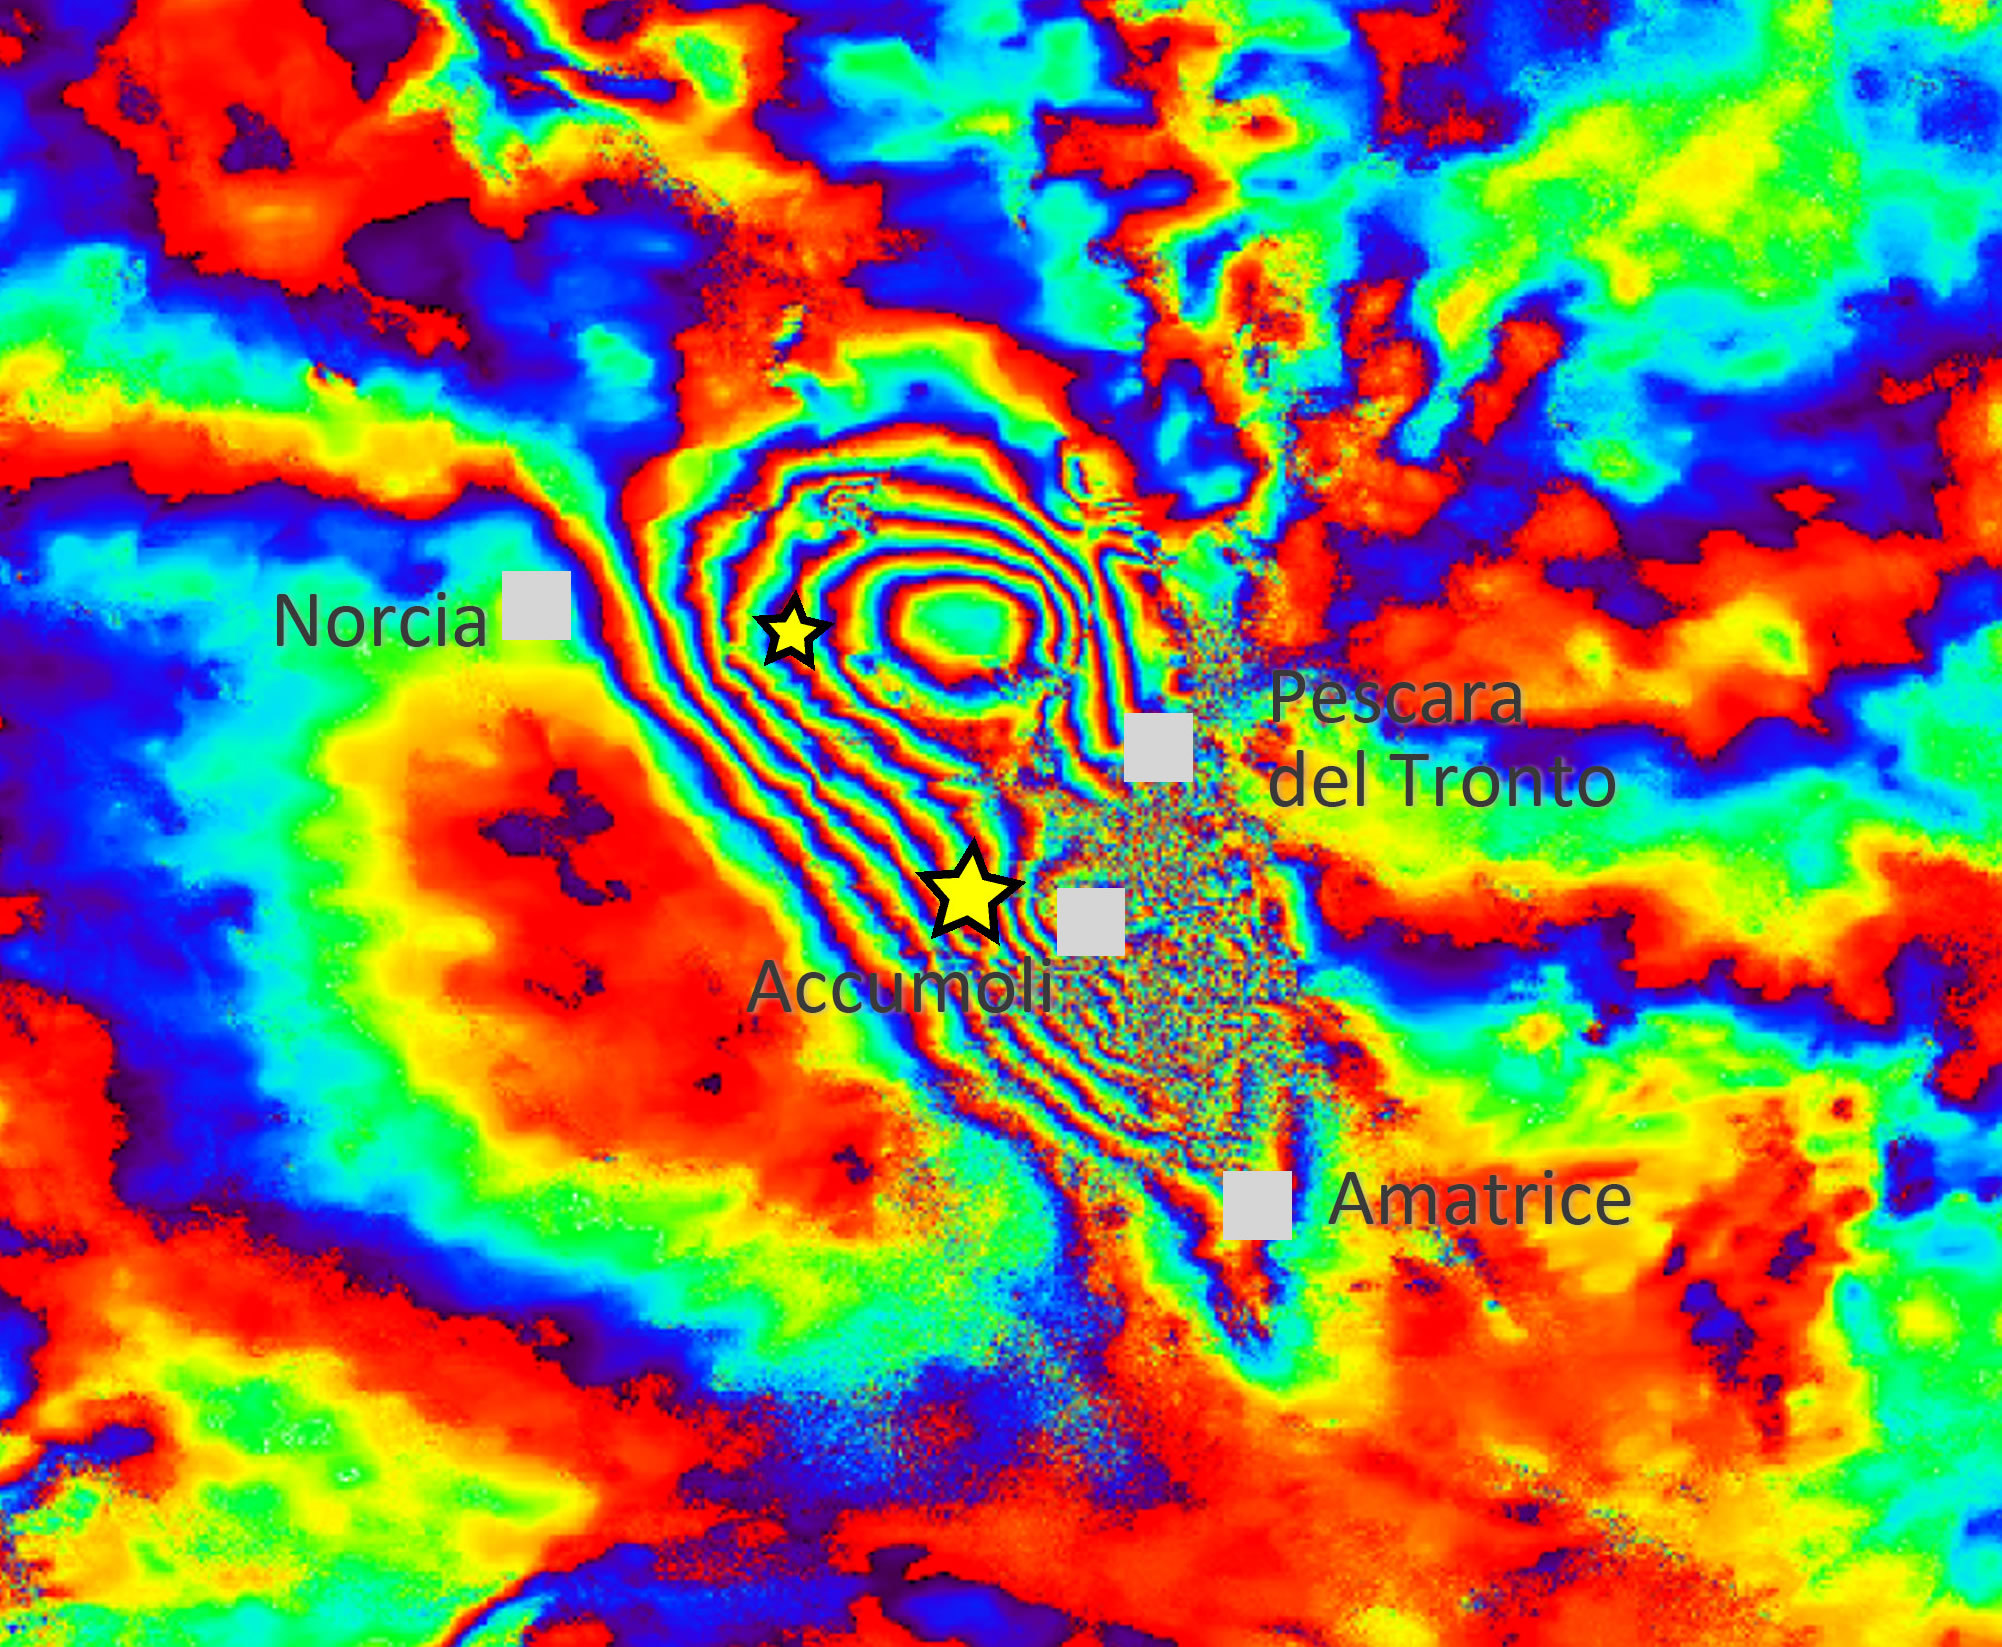
Figure 2: Italy earthquake deformation: Scientists from Italy’s Institute for Electromagnetic Sensing of the Environment combined Sentinel-1 radar acquisitions over central Italy from before and after the earthquake: 15 August and 27 August 2016. The result is an ‘interferogram’ showing ground deformation caused by the 24 August earthquake. [Contains modified Copernicus Sentinel data (2016)/ESA/CNR-IREA]
The scientists use a technique that allows them to map surface deformations by comparing radar images over the affected area taken before and after the event.
The team has benefited from the availability of both Sentinel-1A and Sentinel-1B scans. The scientists were able to quantify the ground movement in both vertical and east–west directions by combining the radar scans obtained as the satellites flew both south to north and north to south.
Sentinel-1 is not the only satellite providing information on this recent quake: scientists are also relying on data from the Italian space agency’s Cosmo-SkyMed satellites, as well as satellite imagery from other space agencies.
In addition, data from a multitude of Copernicus contributing missions are being used to produce maps through the Copernicus Emergency Management Service for damage assessment.
Sentinel-1 is a two-satellite mission for Europe’s Copernicus environment monitoring programme, led by the European Commission. The first satellite – Sentinel-1A – was launched in 2014, while its sister Sentinel-1B is still in its commissioning phase following launch just four months ago.
With its 250 km-wide swatch over land surfaces, Sentinel-1 gives scientists a broad view of the displacement,
allowing them to examine the ground displacement caused by this earthquake and develop the scientific knowledge of quakes.
Once Sentinel-1B is operational next month, it will be possible to perform routine scans over critical areas like Italy every six days with the two-satellite constellation.

Figure 3: Source fault of Italy’s earthquake: Scientists from Italy’s National Institute for Geophysics and Volcanism combined Sentinel-1 radar acquisitions over central Italy from before and after the 24 August earthquake to calculate the location, geometry and amount of slip on the source fault. The slip is distributed mainly in two patches of about 1 m. The aftershock seismicity (black dots) is clearly surrounding these patches, releasing the remaining stress along the fault. The red star is the main shock. Green stars indicate the highest aftershocks of the sequence (M > 4.3). [Contains modified Copernicus Sentinel data (2016)/ESA/INGV]