The GEP is able to provide value added products using a variety of supply chains from the EO sector allowing comparison and better understanding of the techniques employed. For example, six services are available on GEP for the interferometric processing of Sentinel-1 SLC data:
- CNES DIAPASON InSAR Sentinel-1 TOPSAR(IW,EW) [on-demand, available for early adopters]
- CNES DIAPASON InSAR - StripMap(SM) [on-demand, available for early adopters]
- CNR-IREA P-SBAS Sentinel-1 [on-demand, available for early adopters]
- DLR High-Resolution InSAR Browse Service [systematic, restricted]
- DLR Medium-Resolution InSAR Browse Service [systematic, open access]
- ESA/RSS SNAP Sentinel-1 IW SLC Interferogram and Displacements [on-demand, available for early adopters]
Four of these, DIAPASON, P-SBAS and SNAP, are on-demand processing services. With these, users can process data over their area of interest based on a set of pre-defined but modifiable parameters. The two InSAR Browse Services are fully-automated systematic processing chains that operate over a fixed area of interest. For further information regarding the systematic services see the Volcano Trial Case and Detecting deformation on a global scale through systematic processing with the DLR InSAR Browse Service on the GEP blog.
On April 5th , 2017, an earthquake of magnitude of 6.1 occurred in north-eastern Iran (Earthquake Report). This area is located within the CEOS seismic mask which defines the area of interest for the Medium-Resolution InSAR Browse Service (see GEP_2, Figure 1) and therefore InSAR processing started as soon as the post-event Sentinel-1 acquisition was available. One of the products of this service are interferograms which reveal large scale deformation with centimetre level precision. Figure 1 shows an interferogram produced by the InSAR Browse Service from Sentinel-1 acquisitions on 24 March and 5 April 2017. The area affected by deformation from the earthquake is visible in the centre of the image as a fringe pattern consisting of a series of concentric rings.
Figures 2 and 3 show interferograms over the same area of interested and for the same pair but processed with the CNES DIAPASON InSAR Sentinel-1 TOPSAR(IW,EW) and ESA/RSS SNAP Sentinel-1 IW SLC Interferogram and Displacements processing chains. The DIAPASON product (Figure 2) used a stronger filter leading to a smoother result.
All interferograms were visualised in QGIS with a light transparency on top of a recent Sentinel-2 acquisition (2 March 2017).
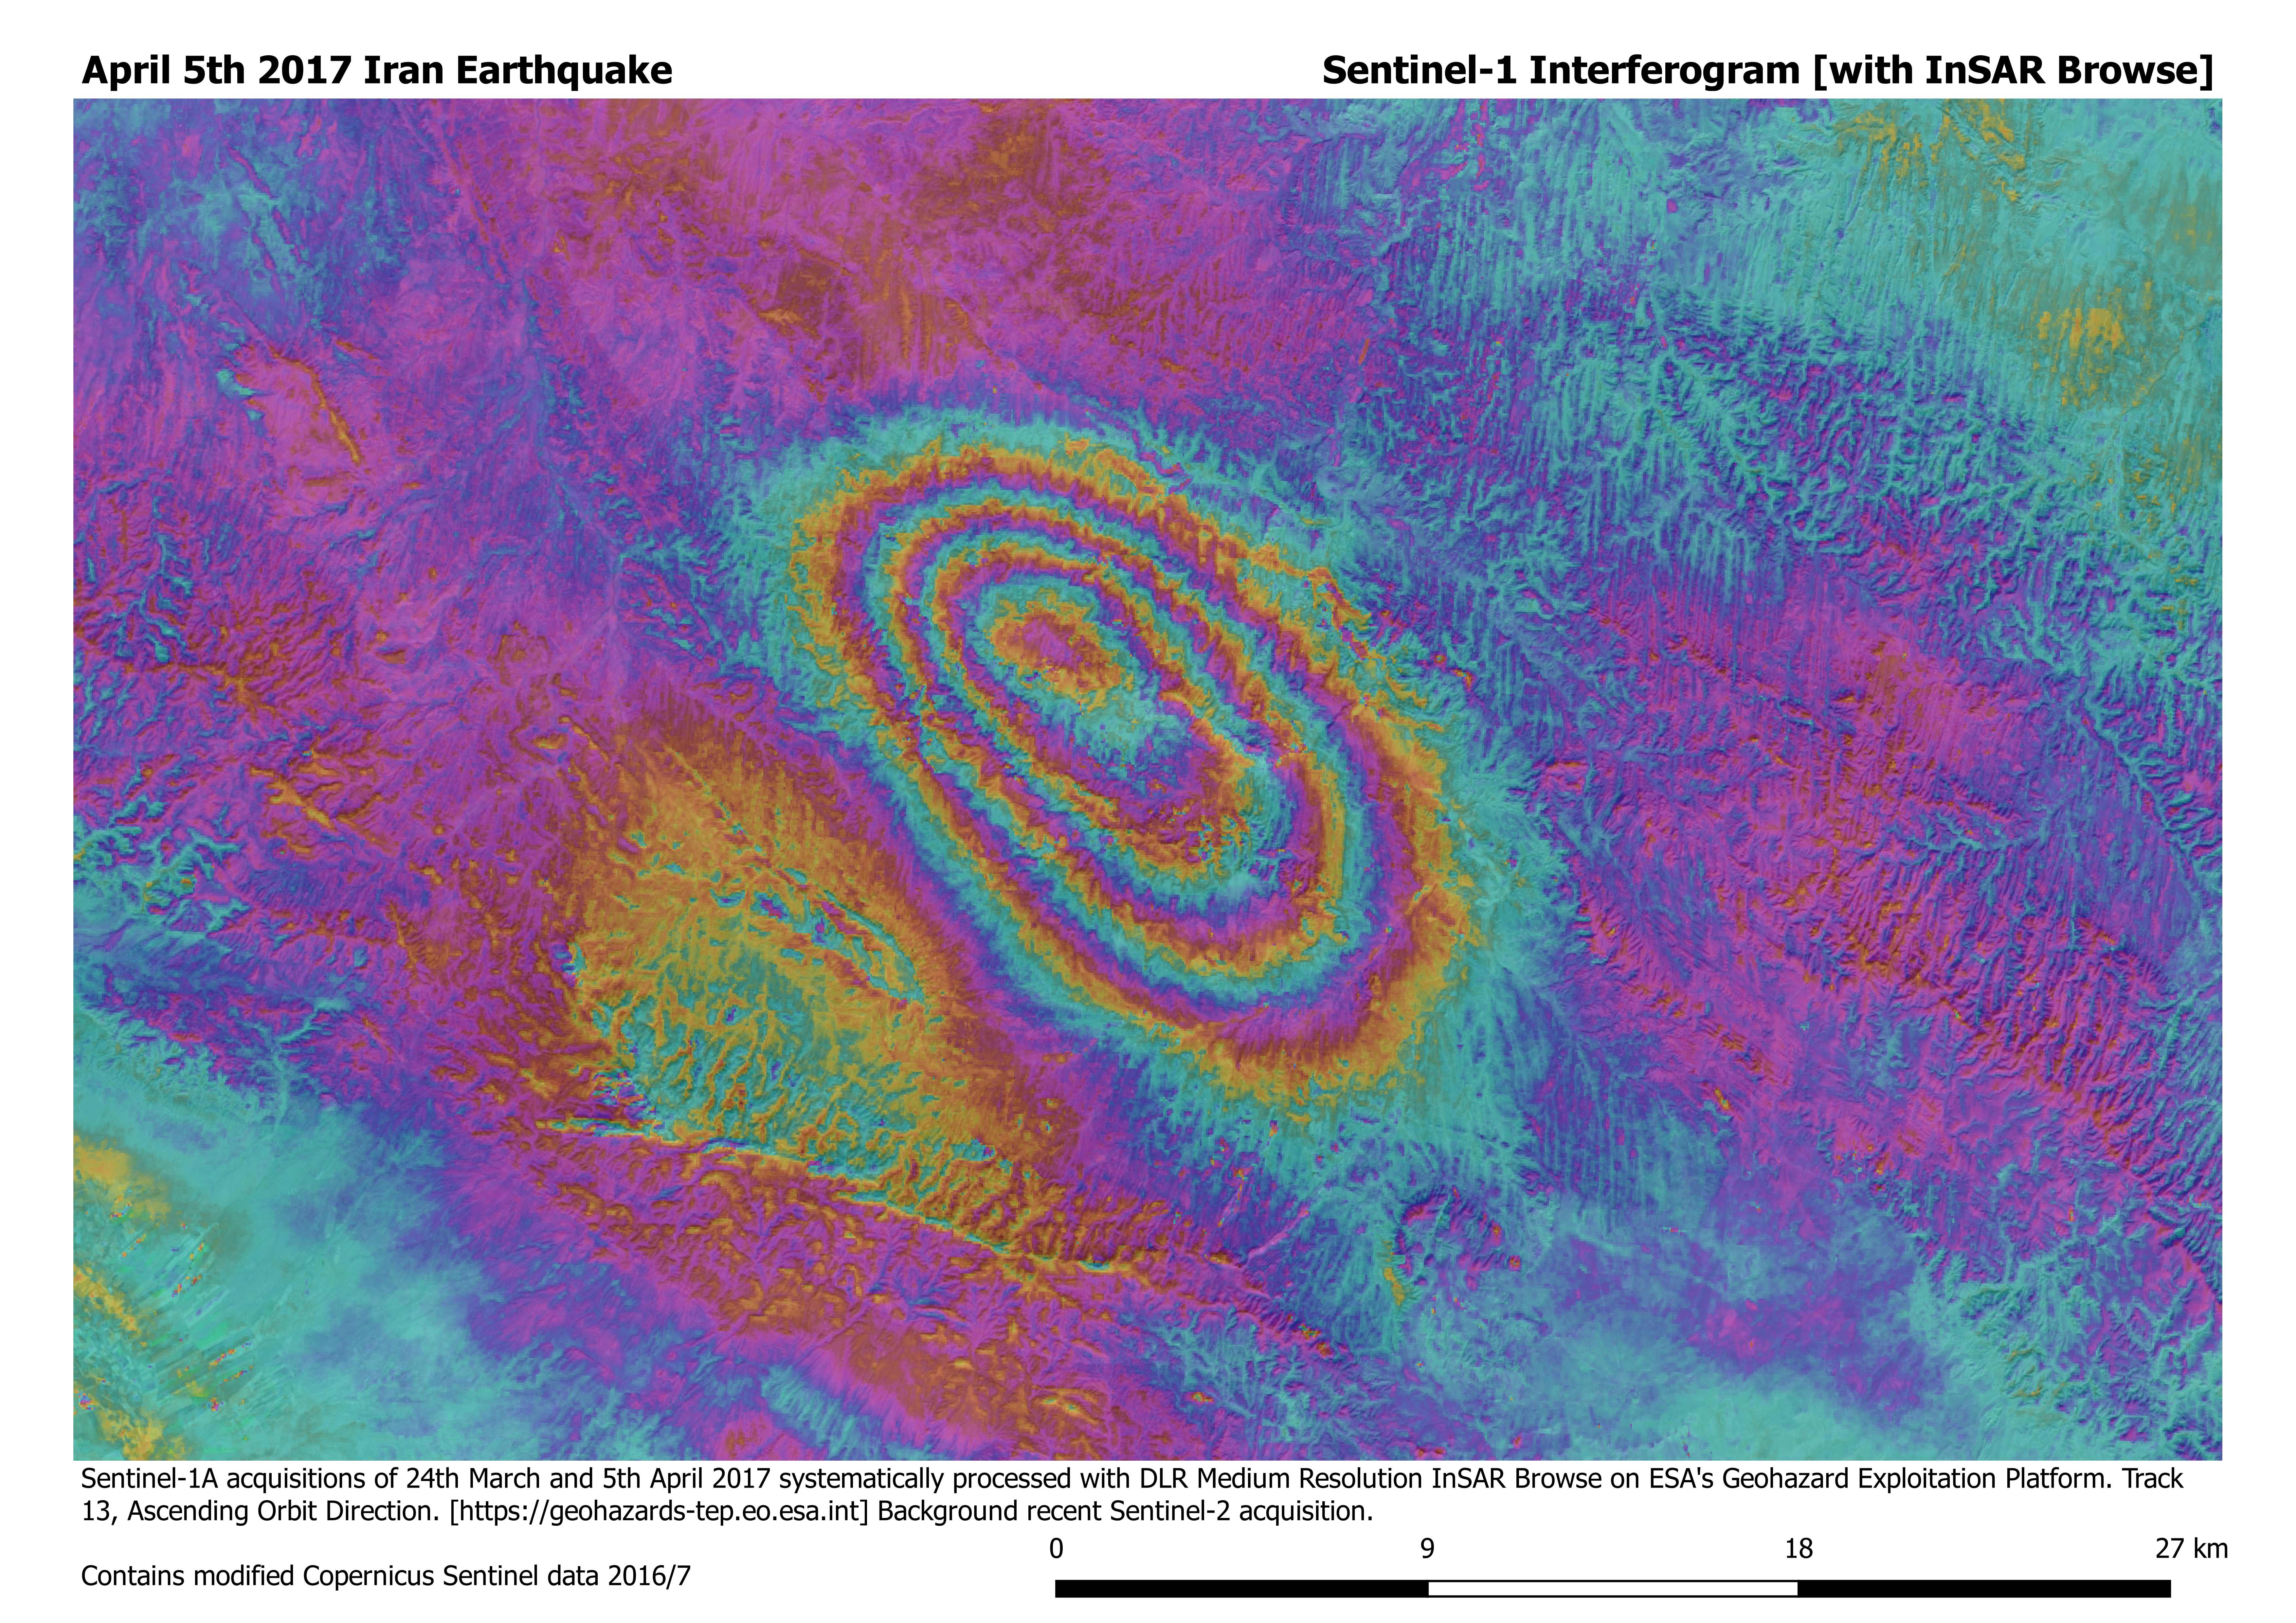
Figure 1: Interferograms generated with DLR’s systematic Medium Resolution InSAR Browse Service processing chain, integrated on GEP.
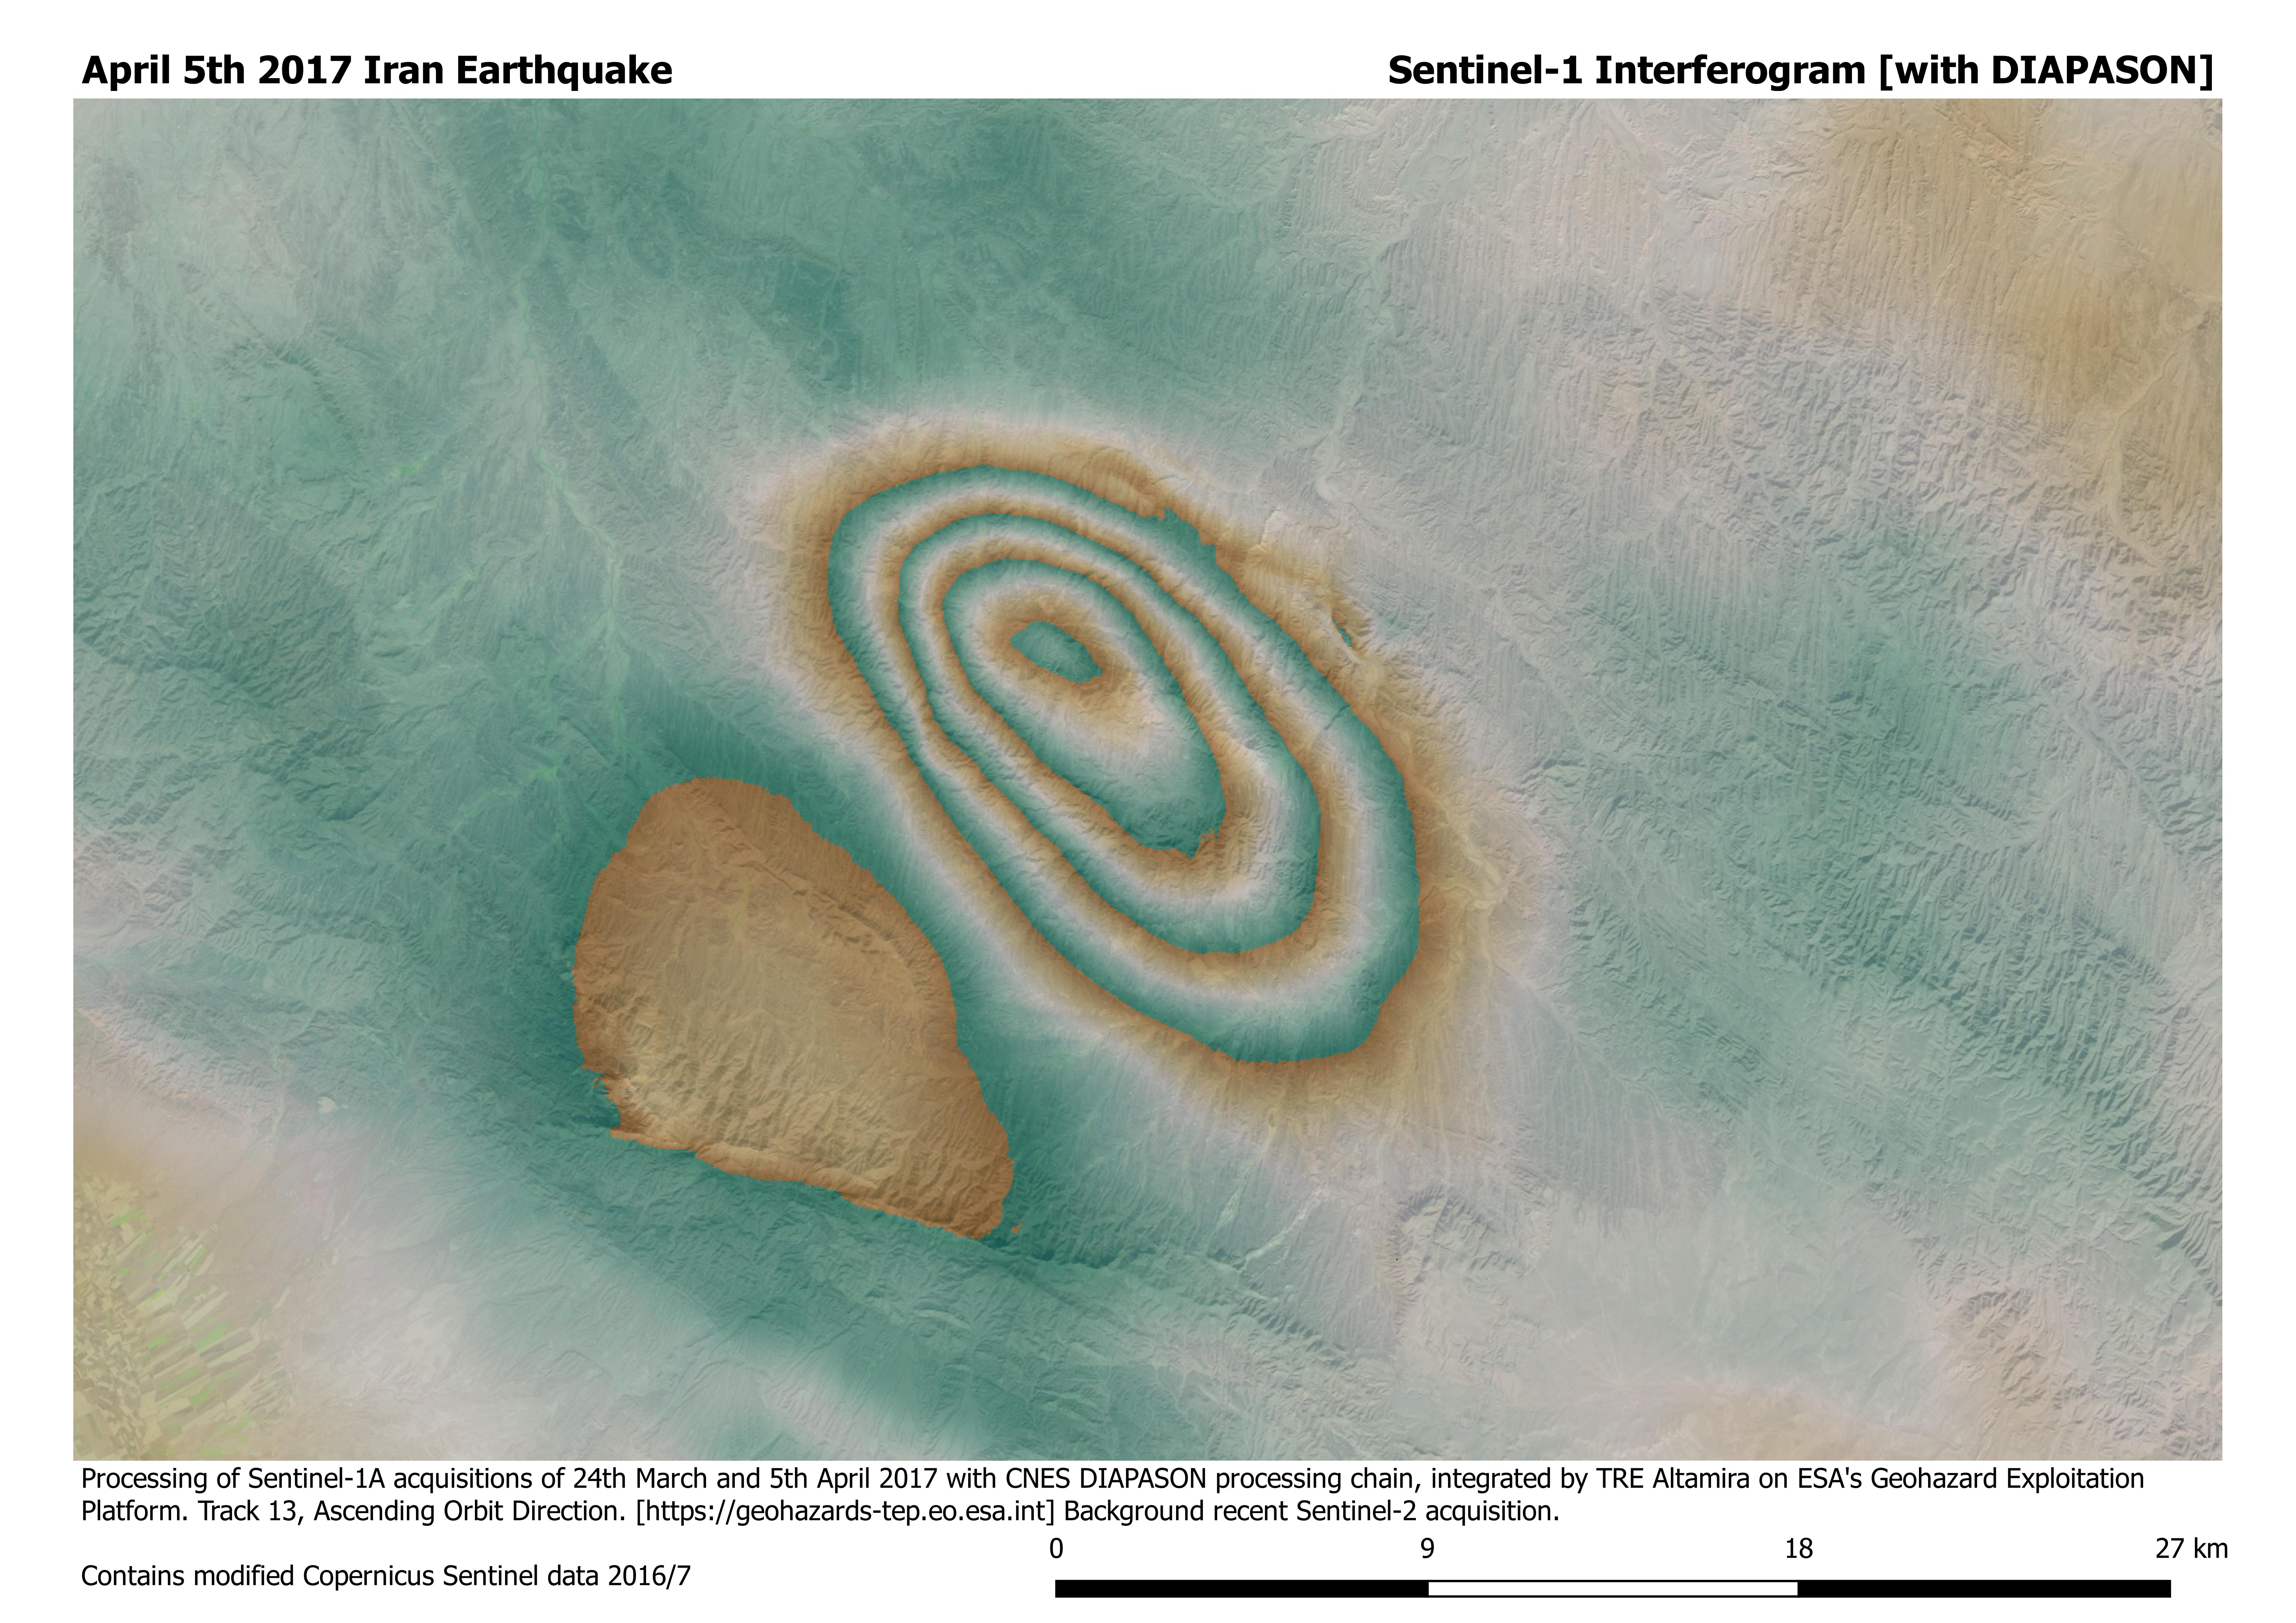
Figure 2: Interferograms generated with CNES’s DIAPASON InSAR Sentinel-1 TOPSAR(IW,EW) on-demand processing chain, integrated on GEP.
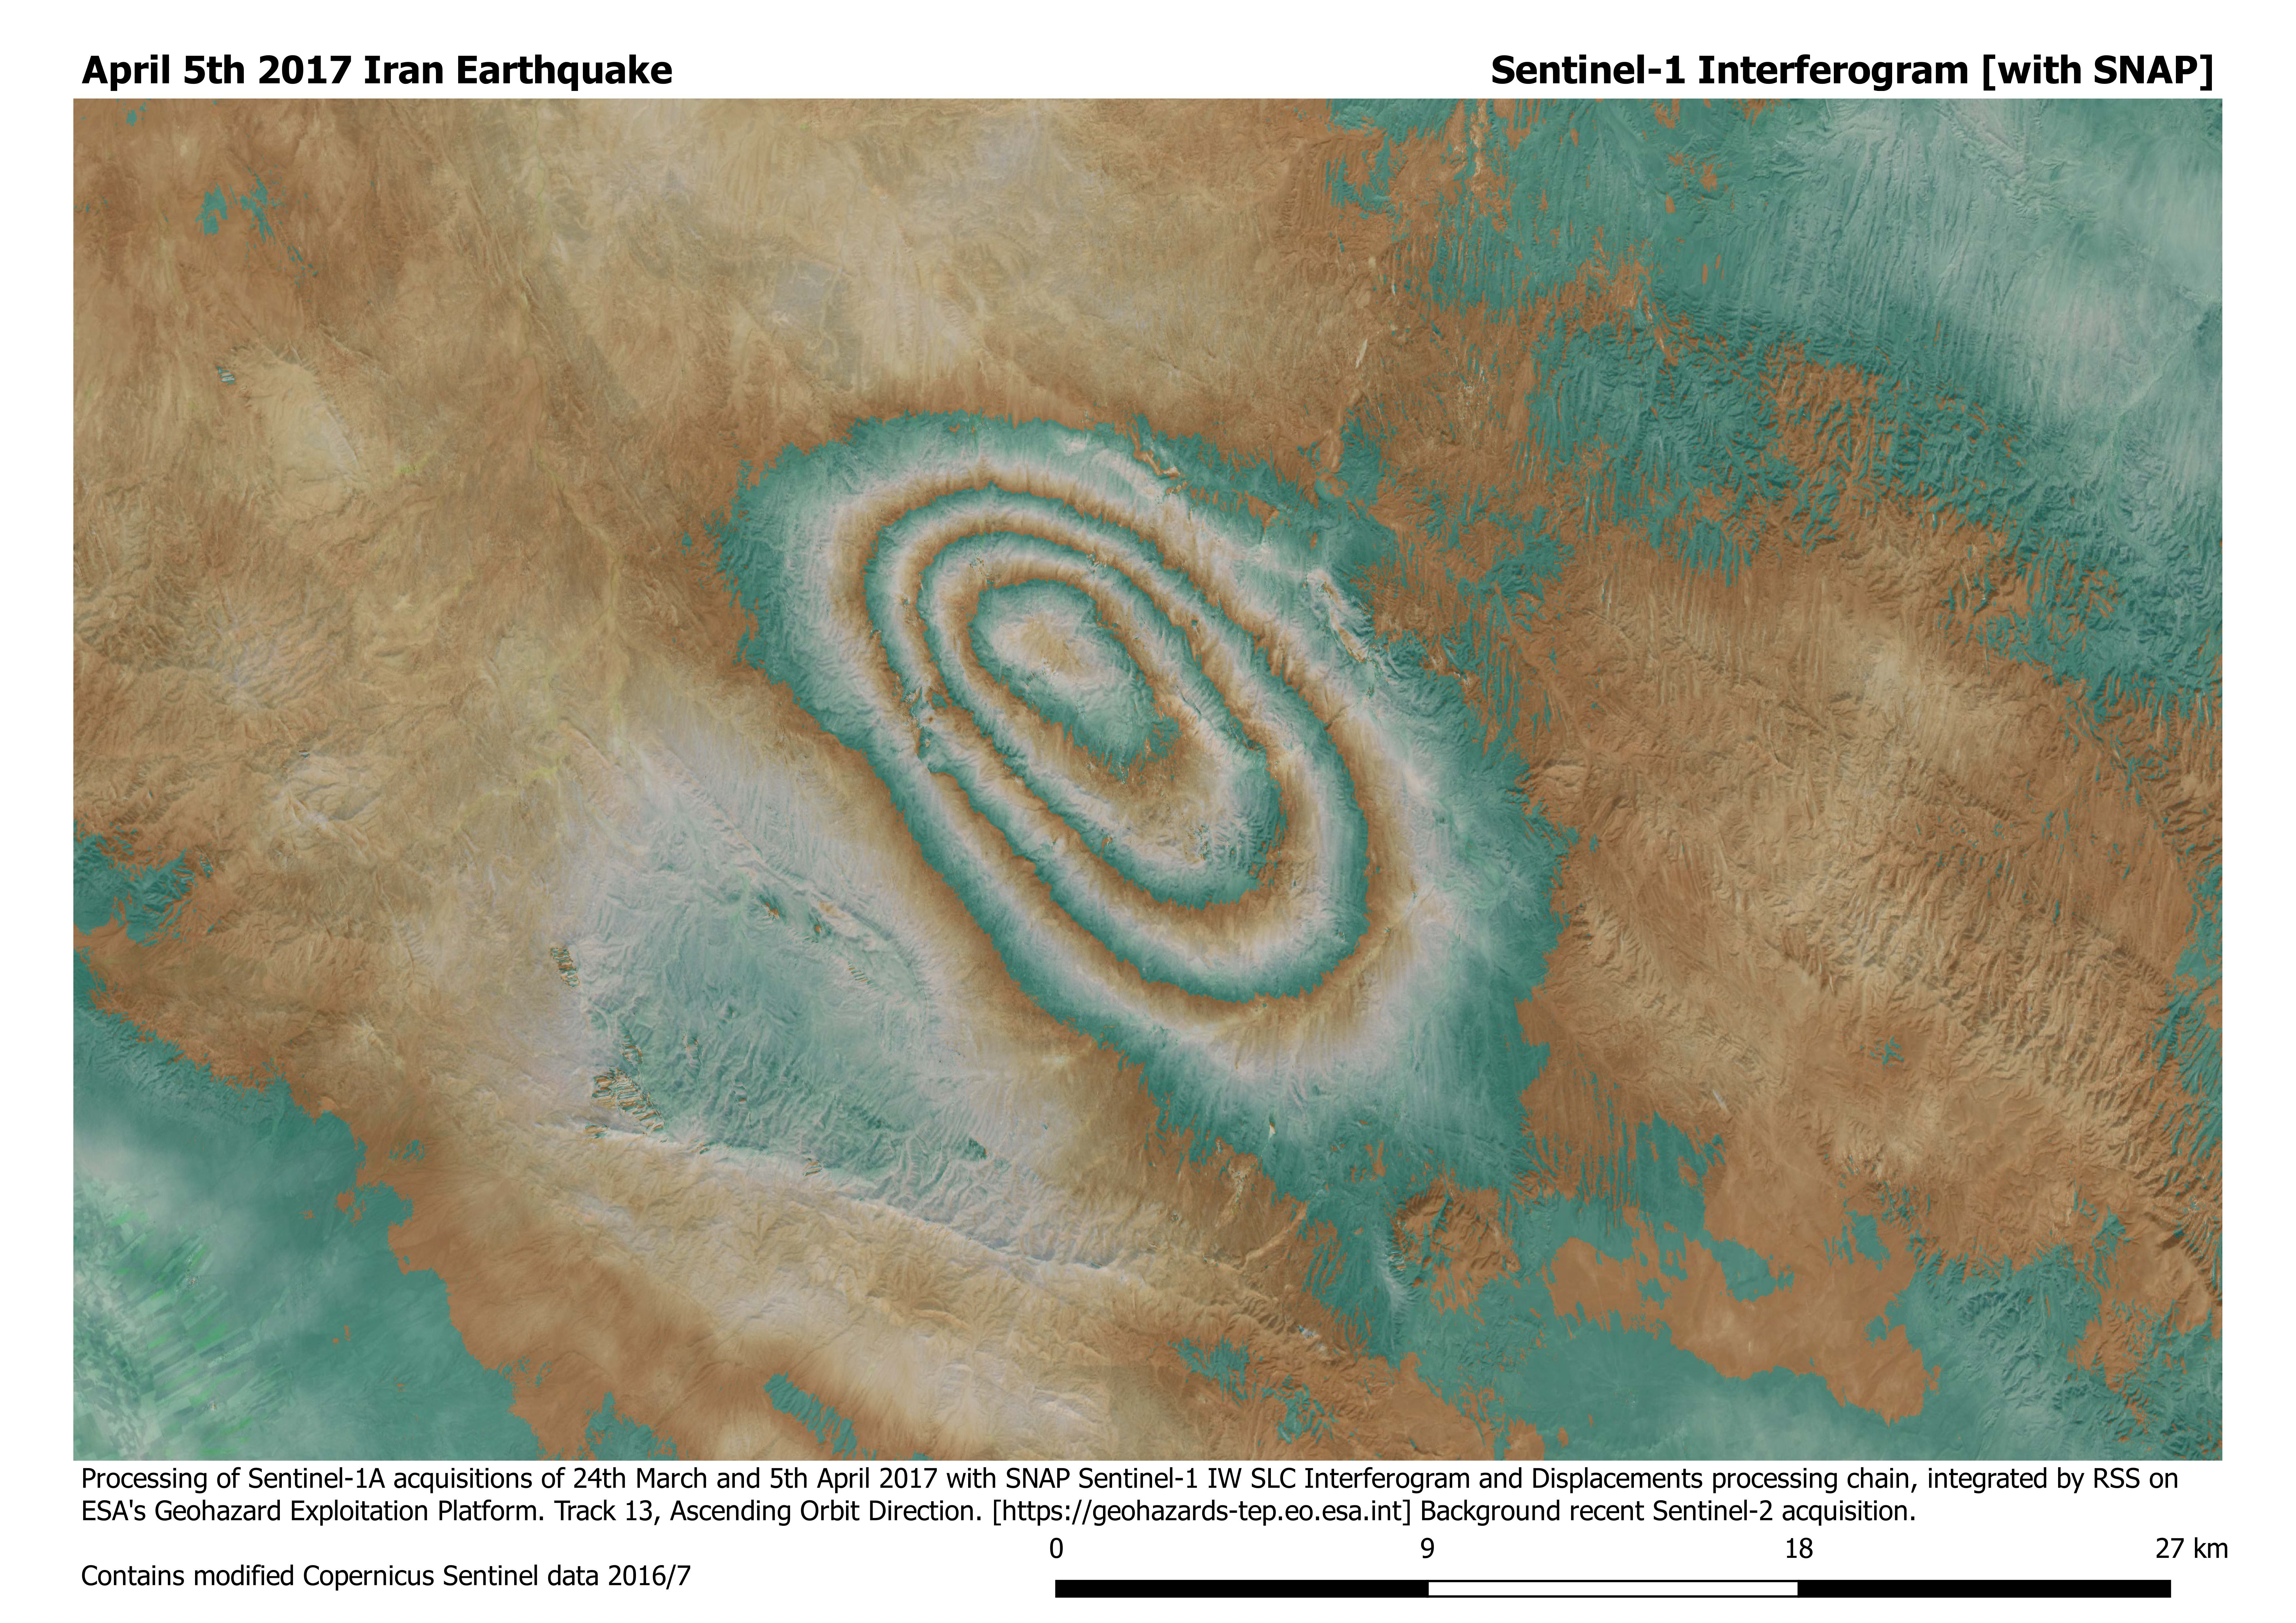
Figure 3: Interferograms generated with ESA/RSS’s SNAP Sentinel-1 IW SLC Interferogram and Displacements on-demand processing chain, integrated on GEP.