Since 2016, the DLR High- and Medium-Resolution InSAR Browse Services have been systematically producing six products from Sentinel-1 IWS (Interferometric Wide Swath) pairs:
Coherence-Amplitude Composite
The coherence-amplitude composite combines the coherence in the red channel with the average calibrated amplitude of the master and slave in the green and blue channels (cyan).
Urban areas stand out in light shades of red or white. Light red indicates high coherence (little change) with medium to high backscatter while areas of very high backscatter appear white. Roads tend to show up in shades of red indicating weak backscatter and little change. Vegetated areas such as forests tend to show up in dark shades of cyan indicating low coherence (significant change) and weak to moderate backscatter. Agricultural fields can show a mixture of these two effects. Fields with little vegetation exhibit few changes over a short period of time and appear red while those with dense vegetation are dark cyan.

Figure 1: Coherence-amplitude composite of the city of Valdivia, Chile, and surroundings.
Amplitude-Change Composite
The amplitude-change composite is designed to highlight a clear change in amplitude between the master (first acquisition) and slave (second acquisition). Up to an absolute change in amplitude of 3dB, one sees the average amplitude on a grey scale. For changes greater than 3dB, an increase in backscatter over time from master to slave appears in red, while a decrease appears in blue.
In the case of a landslide occurring in a vegetated area between the master and slave acquisition times, freshly exposed rock and soil reflect more energy back to the radar and would hence appear red.
When flooding occurs between the master and slave acquisition times, land that become inundated with water reflects less energy back to the radar and hence appears blue (see Figure 2). A similar behaviour can be observed with volcanoes in case of ash cover (see Figure 3).
In coastal areas, a reduction in reflectance caused by ships present in the master but not in the slave is seen as several blue pixels. Alternatively, red pixels result from ships present in the slave but not in the master. Over open water, a change in surface roughness or even debris can induce a change in backscatter and cause it to appear red or blue.
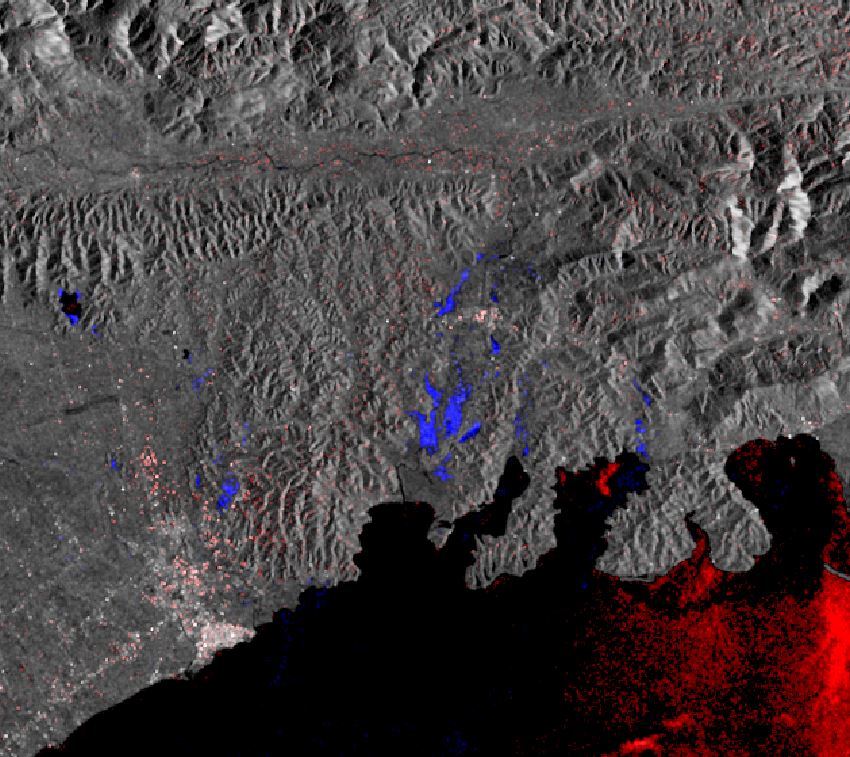
Figure 2: Amplitude-change composite over Les Cayes, Haiti from April 14 to 26, 2017, covering the flood caused by Hurricane Matthew.
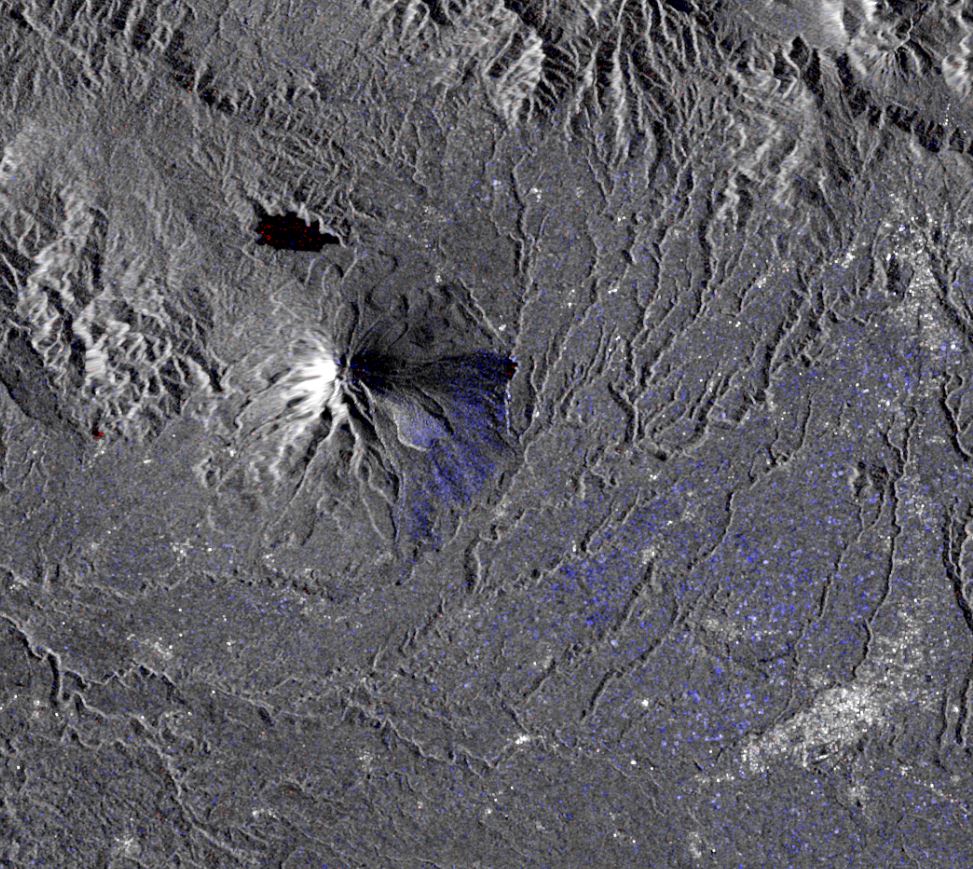
Figure 3: Amplitude-change composite of the volcano Sinabung, obtained from ascending images acquired on June13 and 19 2017. Eruptive deposits on the eastern flank can be recognised in light blue.
Master and Slave Amplitude
The amplitude images show the reflectance of the signal. For the InSAR Browse Service, the master image of an interferometric pair is always the acquisition that was acquired first. For an InSAR pair straddling some event, the master is then pre-event and the slave post-event.
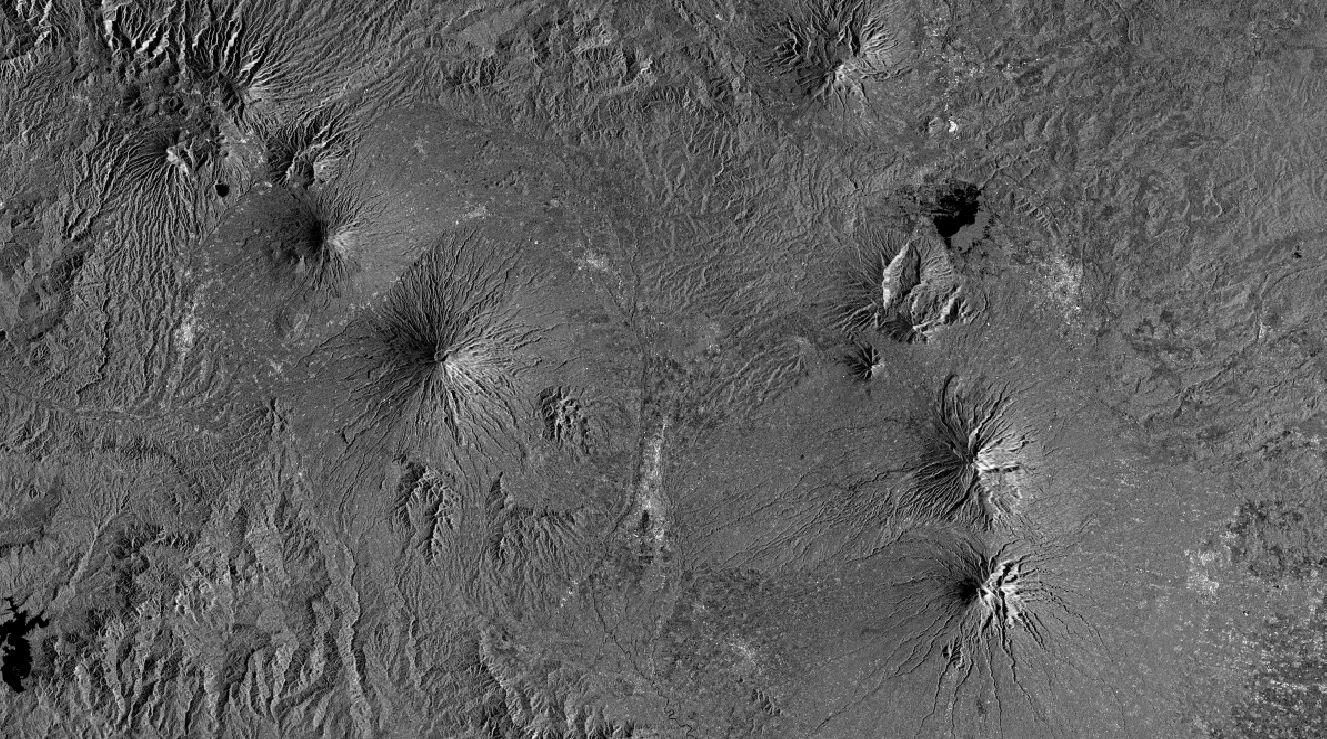
Figure 4: Amplitude image of a group of volcanoes in Indonesia.
Coherence
The coherence image measures detailed changes within the resolution cells between the master and slave. The level of correlation or coherence is shown on a grey scale from black (low coherence) to white (high coherence). Urban areas and ground where little change occurs are therefore bright. Vegetated and water covered areas exhibit low coherence due to the randomness of the returned signal caused by moving leaves and waves.


Figure 5: Coherence image of two Sentinel-1 pairs for the Piton de la Fournaise volcano on La Reunion island, obtained from descending images on January 9 and 21, 2017 (above) and January 21 to February 2, 2017 (below). The eruption in the southern side of the summit caused a decrease in coherence.
Interferometric Phase
The interferometric phase is the phase difference between the reflected waves of the master and slave signals measured at the satellite and contains any surface deformation that occurred between the two acquisitions. The precision of the deformation signal is extremely high, generally an order of magnitude greater than the radar wavelength which is 5.6cm for Sentinel-1. Deformation along the line-of-sight from the radar to a point on the ground appears as a cyclic series of fringes where each fringe corresponds to half a wavelength of movement or 2.8 cm for Sentinel-1.

Figure 6: Interferometric phase image of a Sentinel-1 pair over the Piton de la Fournaise volcano on La Reunion, obtained from descending images on January 21 and February 2, 2017. The eruption on the southern side of the summit caused a deformation of the volcano that resulted in the characteristic fringe pattern.