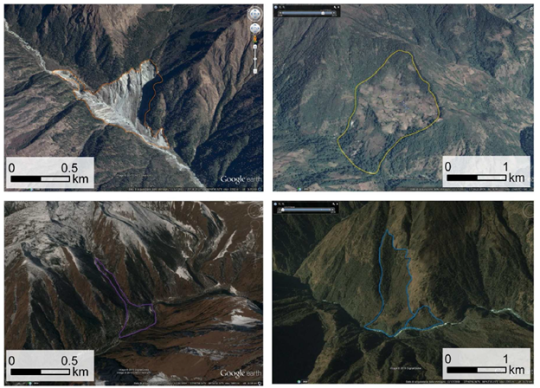
Examples of mapped landslide: clockwise, a surfacial slide (rock fall and active erosion), a rotational rockslide, an earth flow, a rockfall (base image: Google Earth).
ESA has originated a pilot project in the framework of eoworld2, a collaboration between the European Space Agency and the World Bank, to demonstrate the benefit of satellite EO to support Disaster Risk Reduction (DRR) in Nepal and Bhutan. The Hindu Kush Himalayan Mountains are the source of 10 major river systems and provide vital ecosystem goods and services to more than 1.4 billion people spanning a range of countries from Afghanistan, Bangladesh, Bhutan, China, India, Myanmar, Nepal to Pakistan. The World Bank has numerous on-going projects in the Himalayan mountain region, ranging from agriculture, rural roads, climate change, watershed management. In Nepal and Bhutan it is actively involved since several years in projects related to hydroelectricity and infrastructure planning (roads, dams, agriculture) and makes use of existing national data provided by the involved agencies from both countries. The pilot is conducted by a Swiss team comprising of MFB-GeoConsulting GmbH, Gamma Remote Sensing AG and SUPSI-IST. Project users include World Bank staff and local users involved with risk management and sustainable development.
Landslide hazard mapping was performed for the Lukla region in Nepal and the Chomolhari Paro region in Bhutan. These two areas belong to the Himalayas mountain belt. Two main rivers, the Dudh Koshi and Paro are flowing between steep slopes with elevation ranging meanly between 1,800 and 7,000 m asl. Due to the high energy of relief associated with an active tectonic, many slope instabilities occur in these two regions. The landslide hazard assessment over large regions based on EO products represents an important aspect for the disaster risk reduction in the whole Himalayan region. It was performed based on geomorphological analysis using photo-interpretation and via a quantitative approach based on SAR based interferometric analysis of terrain motion.
Landslide hazard mapping was performed by combining EO based landslide inventory maps with surface deformation maps, under the assumption that landslides are more dangerous if moving fast. The surface displacement, determined from satellite SAR interferometry using Persistent Scattered Interferometry (PSI) and differential interferograms (DinSAR) was the main criteria to define the state of activity of mapped landslides. DinSAR has been applied to stacks of ERS-1 and ERS-2 SAR, ENVISAT ASAR, ALOS PALSAR, TerraSAR-X and Radarsat-2 images acquired between 1992 and 2014 from ascending and descending orbits for a better spatial coverage. Displacement is derived from the interpretation of the phase difference of the signals acquired by two satellite SAR acquisitions after compensation of the topographic effects with use of the TanDEM-X DEM. To make more understandable the data interpretation, in the landslide hazard mapping the state of activity was summarized in three main classes: active, inactive/dormant and relicts. The state of activity, and thus the landslide hazard, was determined according to the guidelines developed in Switzerland. According to these low intensity is assigned to landslides characterized by mean velocities below 2 cm/yr, moderate intensity to velocities ranging between 2 and 10 cm/yr, and high intensity to velocity higher than 10 cm/yr.
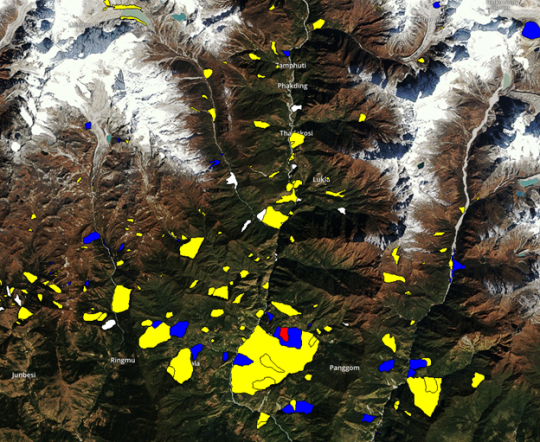
Illustration of a landslide hazard map over Lukla, Nepal, and the associated color key.
In total, 7.5% of the Lukla area extending over 725 km2 is affected by landslide. 210 landslides were mapped, distinguished in 20 Deep Seated Gravitational Slope Deformations (DSGSDs, in Yellow in the illustration), 117 rockslides, 30 rockfalls, 7 flows and 36 surficial slides (active erosion zones). Considering the type of landslide, the major number is represented by slides (56%) but in terms of percentage on total landslide area, deep seated gravitational slope deformations cover the major surface (57% of total landslide area). Flows i.e. material that deform permanently under the influence of a constant mechanical stress represent only the 3% of the total number of mapped landslides. Regarding the state of activity most of mapped landslides were classified as active (44% of the total number).
This pilot has generated 23 products over both countries that have been made available on line with the Geohazards platform. They represent 80 maps and map tiles, 41 in Nepal and 39 in Bhutan. These products have not been generated using platform based EO processing, they are published on the GEP to take benefit of its geobrowser capabilities for viewing results.
As an example the link below provide access to 4 Landslide maps over Lukla in Nepal namely a morphostructures map, a map of instabilities, the state of activity and the landslide hazard map.