The Geohazards Exploitation Platform hosts several processing services generating large amounts of data and measurements. GEP v2 provides a Jupyter Notebook service for exploring and analysing this wealth of data generated on the Platform.
The GEP Jupyter Notebook service delivers a web application that allows platform users to create documents that contain live code, equations, visualizations and explanatory text. The typical uses of Jupyter Notebook include:
- data cleaning and transformation,
- numerical simulation,
- statistical modeling, and
- machine learning.
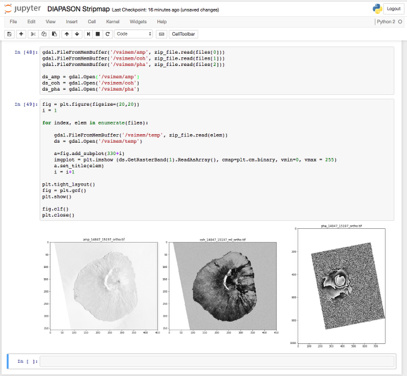
Figure 1 - Invoking the Geohazards Thematic Platform DIAPASON Stripmap service over Fogo volcano using Jupyter Notebooks
The Jupyter Notebook web application is the GUI with IDE capabilities offering a powerful “scratchpad” paradigm for the creation and management of live computational documents with rich media. Users can execute blocks of code (provided by a given kernel) in the browser with automatic syntax highlighting, indentation, and tab completion/introspection. First and foremost, the web application is an interactive environment for writing and running code directly in an associated kernel.
In a code cell it is possible to edit and write new code, with full syntax highlighting and tab completion. By default, the language associated to a code cell is Python, but depending on the kernel, other languages, such as Julia and R, can be handled interactively. When a code cell is executed, its code is sent to the kernel associated with the notebook and the results that are returned from this computation are displayed in the notebook as the cell’s output. The output is not limited to text, with many other possible forms of output are also possible.
The GEP Jupyter Notebook service provides a set of getting started examples:
- Multitemporal SAR composites using GDAL with the objective of showing how to create multitemporal SAR composites using DLR’s InSAR Browse results using GDAL.
- Multitemporal SAR composites using the Orfeo Toolbox with the objective of showing how to create multitemporal SAR composites using DLR’s InSAR Browse results.
- TerraSAR-X interferometry analysis using the Orfeo Toolbox and sandbox results
- by querying the sandbox results and showing how to plot the phase and intensity of a TerraSAR-X interferogram.
- VISHMO - Visualization of horizontal motion fields with R that plots horizontal and vertical displacement with R and VISHMO.
- Read and plot SBAS time series that downloads a SBAS EPOSAR processing service result, inspects the data and plots the mean velocity and the time-series for a given location.
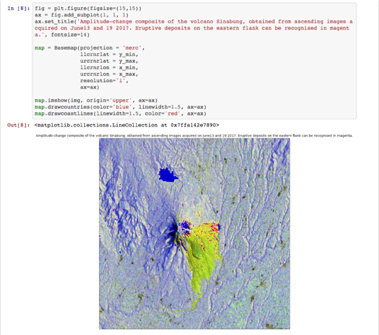
Figure 2 - Amplitude-change composite of Sinabung volcano obtained from Sentinel-1 acquisitions on 13th and 19th June 2017
The GEP Jupyter Notebook service can be started by authorized GEP users having a linked account on Terradue Cloud Platform, by accessing their Cloud Dashboard interface.
GEP welcomes new partnerships to collaborate on value-adding services.
You can contact us by replying to this topic, or by emailing to the ‘contact’ link here.