Volcanoes can be found all over the world; on land and below water surface. Even nowadays not all volcanoes are known. About 600 erupted in geologically recent times and about 50-70 volcanoes are currently active. Volcanoes can cause earthquakes; throw out blasts and tephras; release (toxic) gases; lava can flow relatively slow down the slopes; mass movements like debris avalanches, and landslides can cause tsunamis; and fast and hot pyroclastic surge, flows, and lahars can travel fast down the slopes. These are non-negligible hazards and should be monitored to avoid loss of life and reduce the economic impact.
In the framework of the project about Disaster Risk Reduction using innovative data exploitation methods and space assets that is led by eGEOS in the framework of ESA’s GSP programme, the Geohazards Exploitation Platform is systematically processing EO data over more than twenty volcanoes in South-East Asia, Latin America, and Europe. Different systematic processing services have been implemented by DLR, NOVELTIS, and INGV. They allow to monitor the volcanoes and their environment for
- surface changes with amplitude and coherence images of the DLR High-Resolution InSAR Browse, based on Sentinel-1.
- surface motion with interferometric phase images of the DLR High-Resolution InSAR Browse, based on Sentinel-1.
- surface temperature estimation with INGV’s Surface Temperature Map, based on Landsat-8 and Sentinel-3.
- surface temperature anomalies with NOVELTIS VEGAN Hot Sports Detection, based on Sentinel-2.
- and NOVELTIS Vegetation Vigor Map, a prototype service looking at vegetation cover in the neighbourhood of a volcano and based on Sentinel-2.
Product examples produced within the Trial Case can be seen in the following figures.
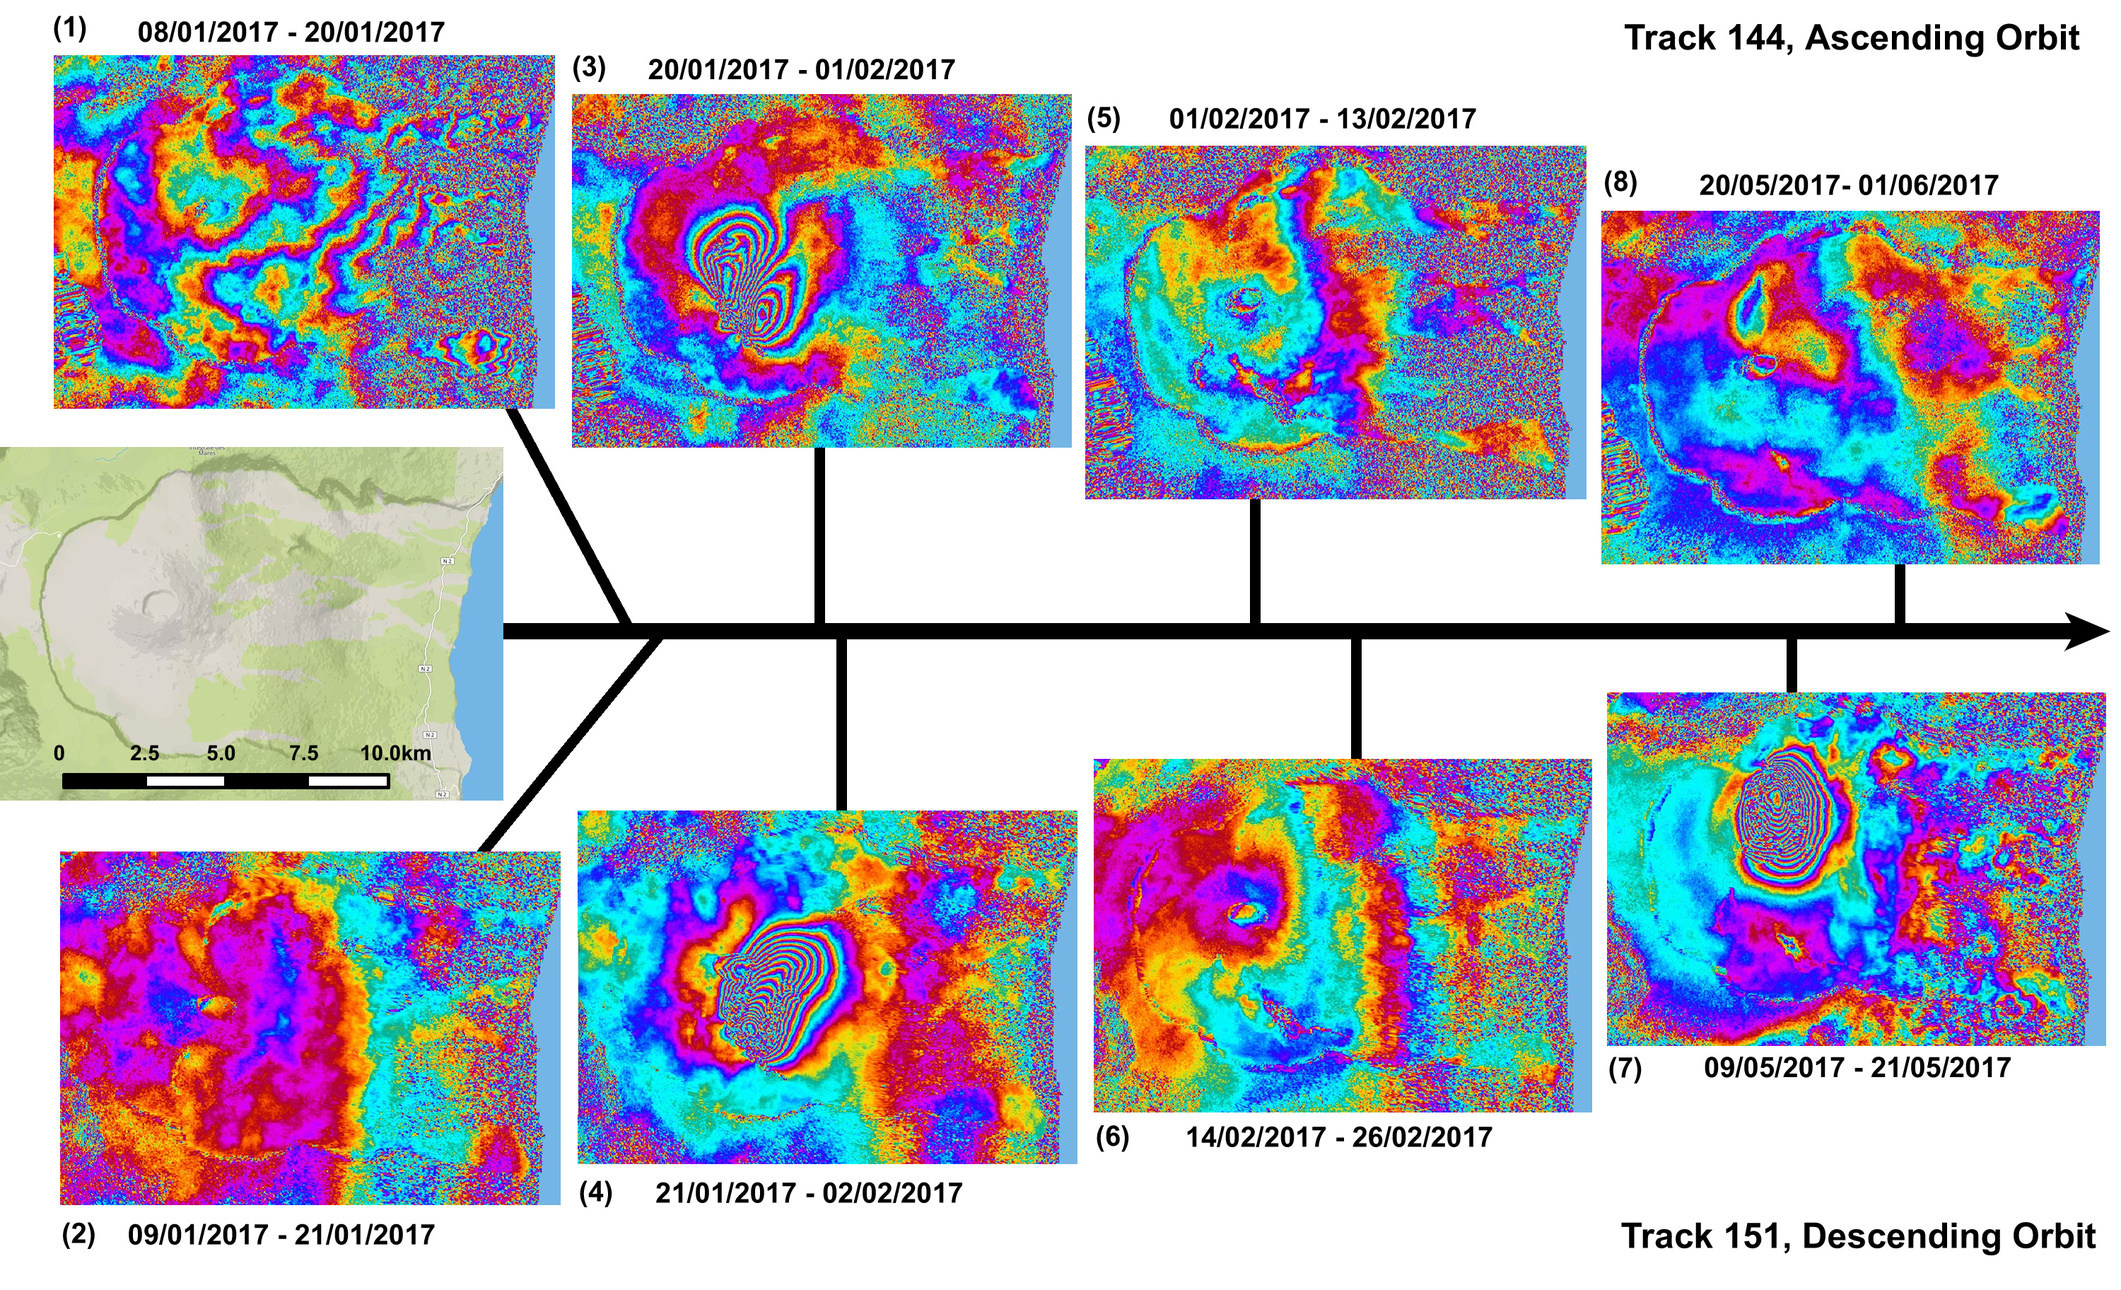
Figure 1: A time series of Sentinel-1 interferograms computed with the DLR High-Resolution InSAR Browse, a systematic processing chain on GEP. The volcano Piton de la Fournaise is an active volcano on the island La Reunion (France). Eruptions were recorded on 31st January and 17th May 2017. The fringe patterns related to these eruptions are clearly visible on the acquisitions (3), (4) and (7). On the other acquisitions the signals are dominated by the atmosphere.
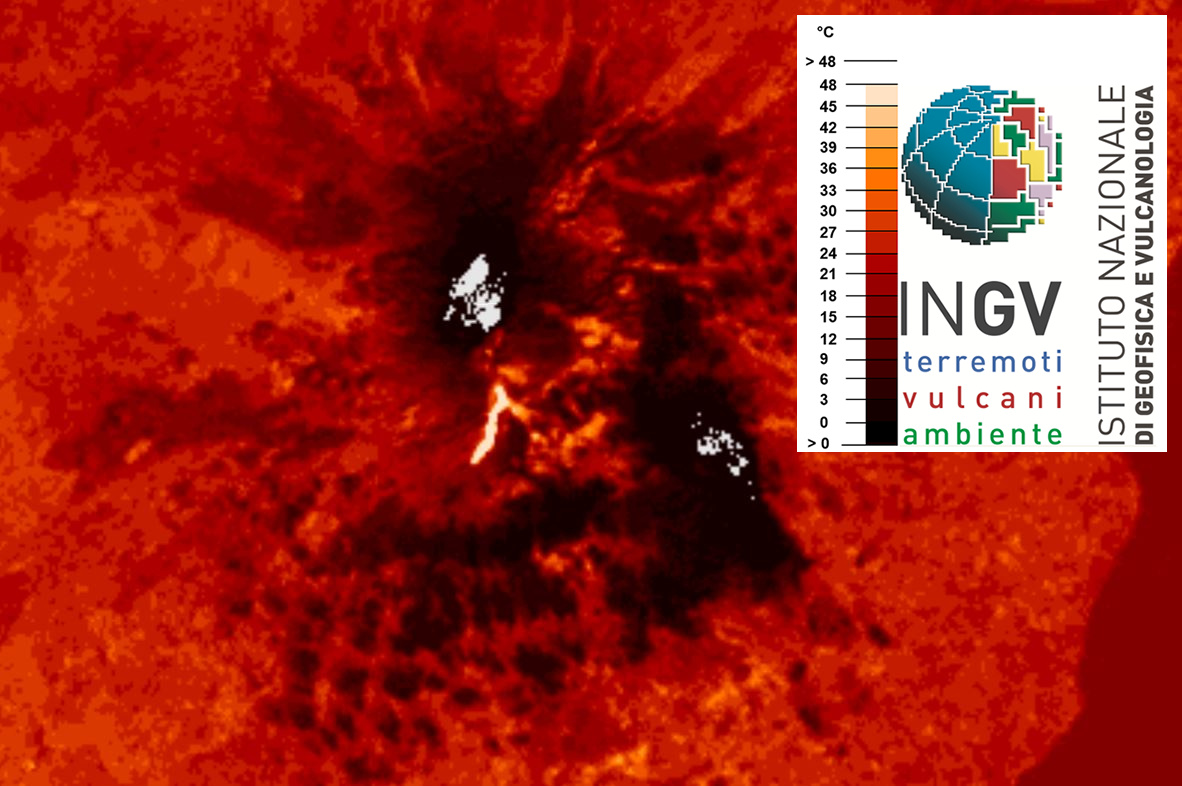
Figure 2: Surface Temperature Map of 27th March 2017 of the volcano Etna. It was created with the INGV STEMP service, a systematic processing chain on GEP. The lava flow in bright white-yellow is clearly visible in the middle of the image.
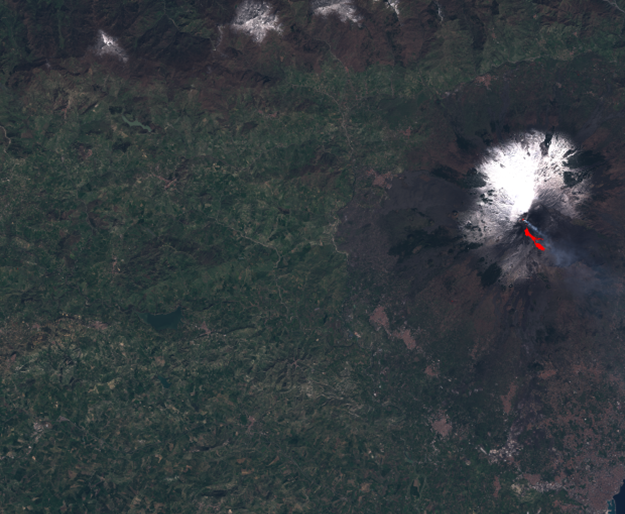
Figure 3: NOVELTIS systematic processing service VEGAN HSP created this Hot Spot Map based on a Sentinel-2 acquisition of the 19th of March 2017. The lava flow of Mount Etna is visible in bright red on the right side of the image.

Figure 4: A vegetation vigor map (NDVI) of the south-western part of Mount Etna, created with VEGAN VHON, the systematic processing service of NOVELTIS on GEP. The underlying basic product for this service was a Sentinel-2 acquisition of the 18th of April 2017. The NDVI values are visualised in green.