The town of Joshimath, located in the Chamoli District (Northern India), is currently facing a major gravitational instability (see AGU Landslide Blog of January 4, 2023 and of January 11, 2023). Houses and roads are undergoing severe damage with large cracks developing rapidly. The town is located on steep slopes and has been constructed on unconsolidated soils that are known to be unstable for several decades. In the past 2 weeks, the motion of the slope has become worrying.
Satellite observations of the Copernicus Sentinel program provide regular acquisition over the entire globe. In particular, Sentinel-1 radar images can be processed with advanced interferometric (InSAR) techniques that are well-suited for the detection of surface motion and the monitoring of its space and time evolution.
The SNAPPING PSI Full Resolution service has been used to compute the displacement time series over the broader region of Joshimath. Archived imagery from the Sentinel-1 ascending track 129 was processed (150 scenes) covering the period from January 2018 to December 31, 2022. The service allows measuring the surface displacement velocities and corresponding time series on highly reflective and stable radar target points (known as PS - Persistent Scatterers) on the ground (e.g. buildings, metallic objects, bare rocks) with millimeter level accuracy.
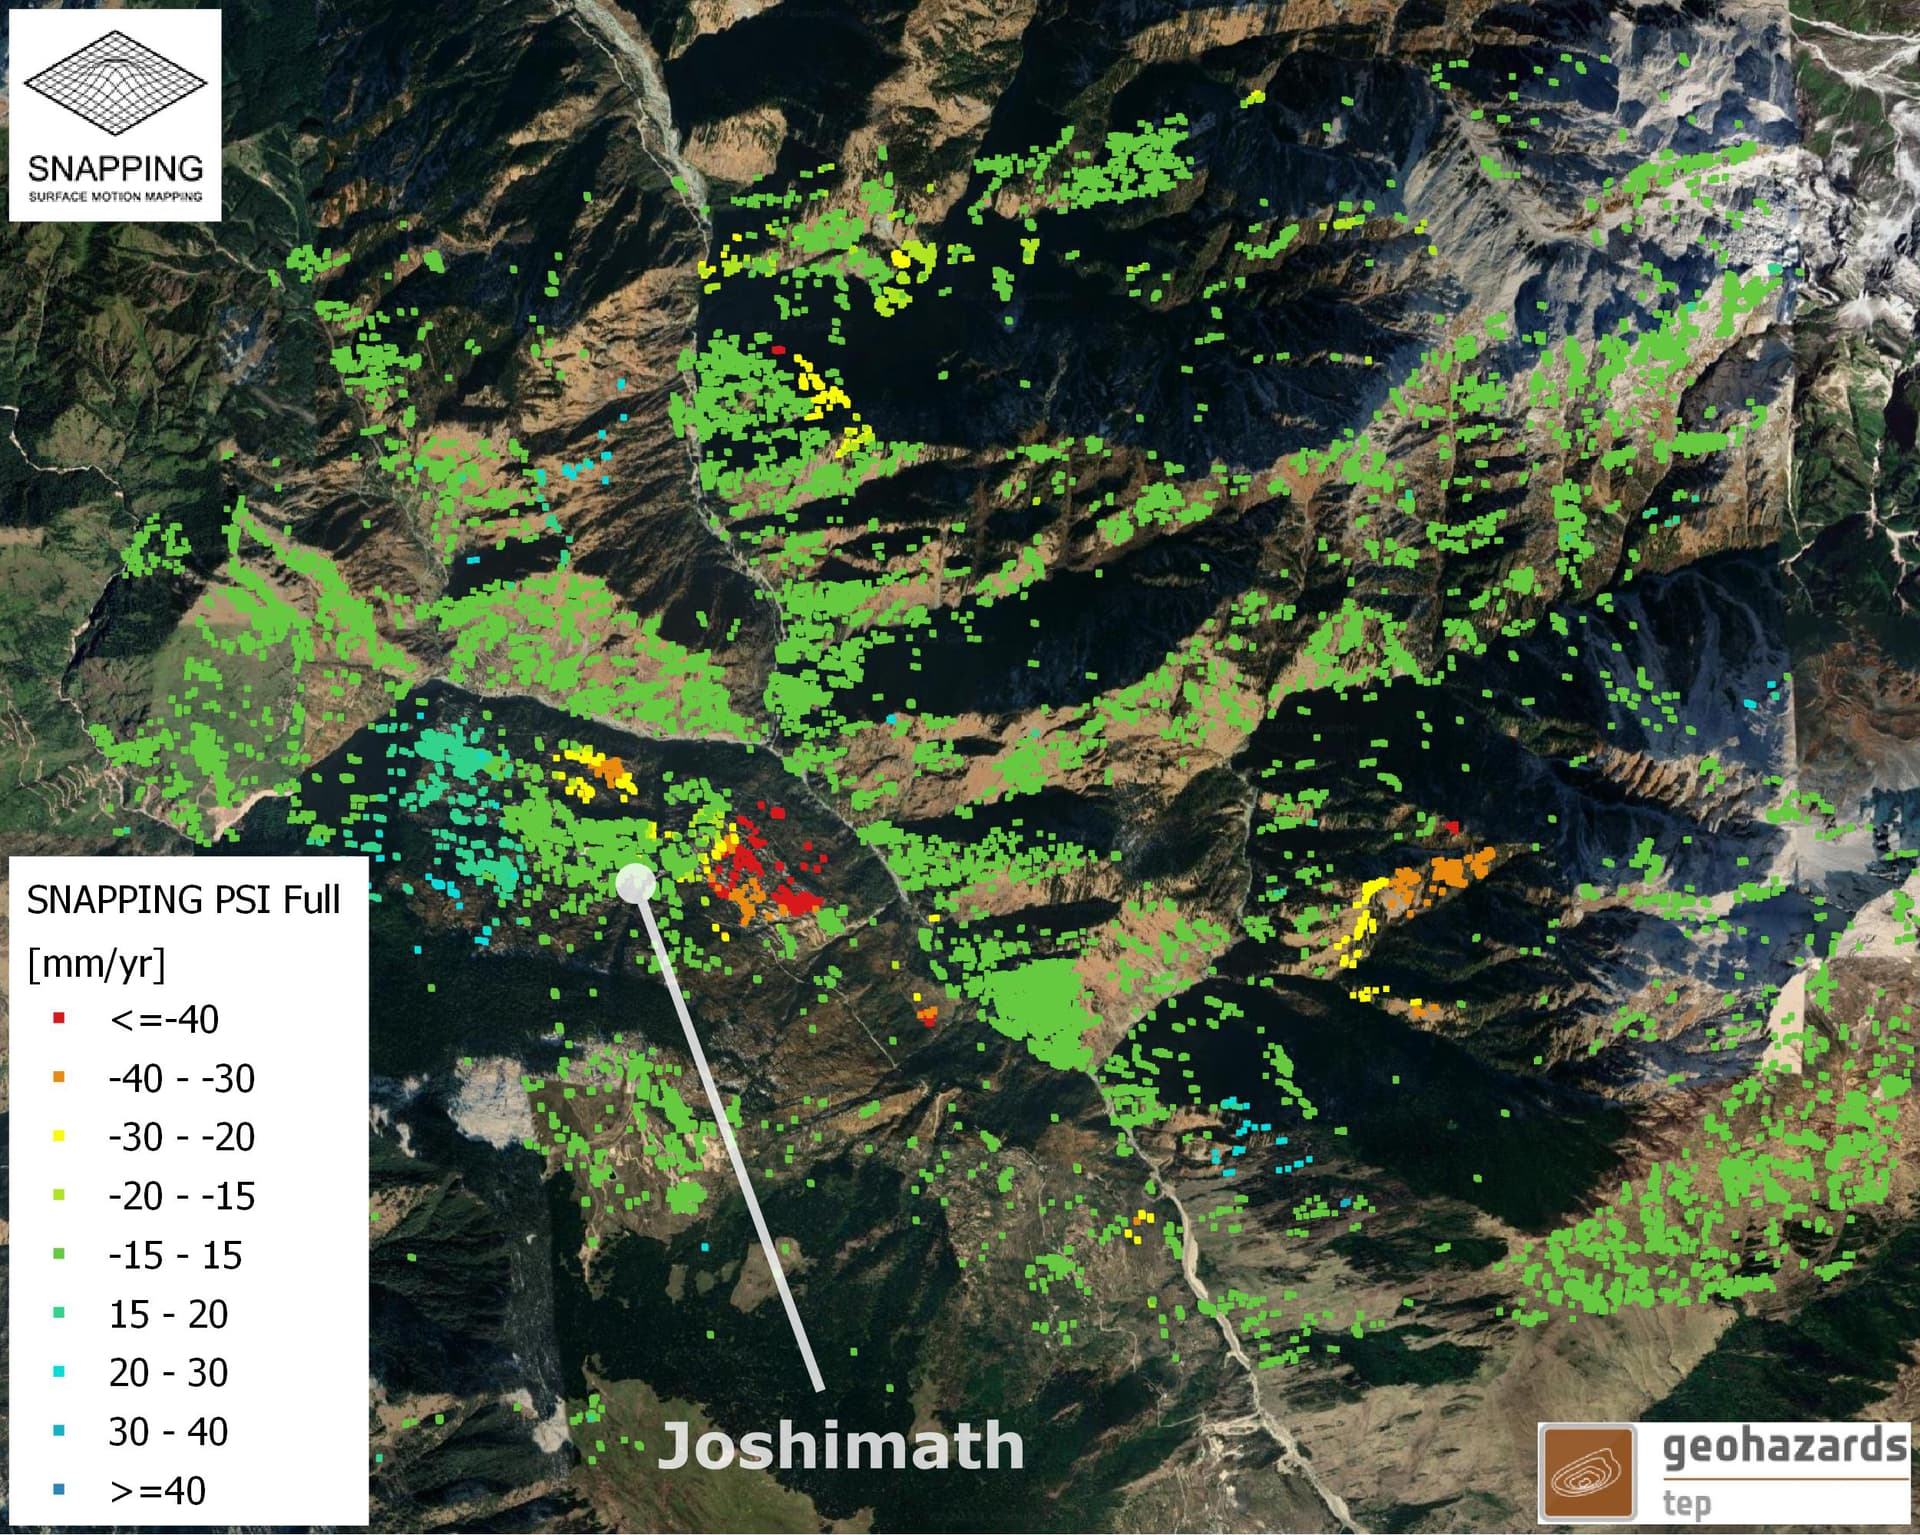
Figure 1 - Sentinel-1 average PSI LoS velocities over the broader Joshimath region (Northern India) for the period 01/2018 to 08/2022 along the ascending track 129, based on SNAPPING PSI Full Resolution service (accessible on the GEP platform). Location of the main unstable slopes in the region is evident. Contains modified Copernicus Sentinel-1 mission data (2018-2022).
Figure 1 shows the average LoS (Line-Of-Sight) PS interferometry velocities over the Joshimath slope and the surrounding areas. A clear deformation signal is visible at the town of Joshimath as well as on the opposite slopes, while the rest of the region seems relatively stable. Figure 2 displays the obtained PSI velocities focused on the Joshimath slope, where four spatial units with distinct displacement patterns are identified. It appears that two zones (units A and B, Figure 2) have been continuously moving in the past four years (> 2018) on the downhill part of the slope. The surface displacement rates are higher in the Eastern part of the slope (unit A) with a value exceeding 10 cm.year-1 for the period 2018 to 2022. A second zone is also visible on the Western side (unit B) with displacement rates of up to 3 cm.year-1. The rest of the slope, mostly in the upper parts, shows lower average velocities (< 2 cm.year-1).
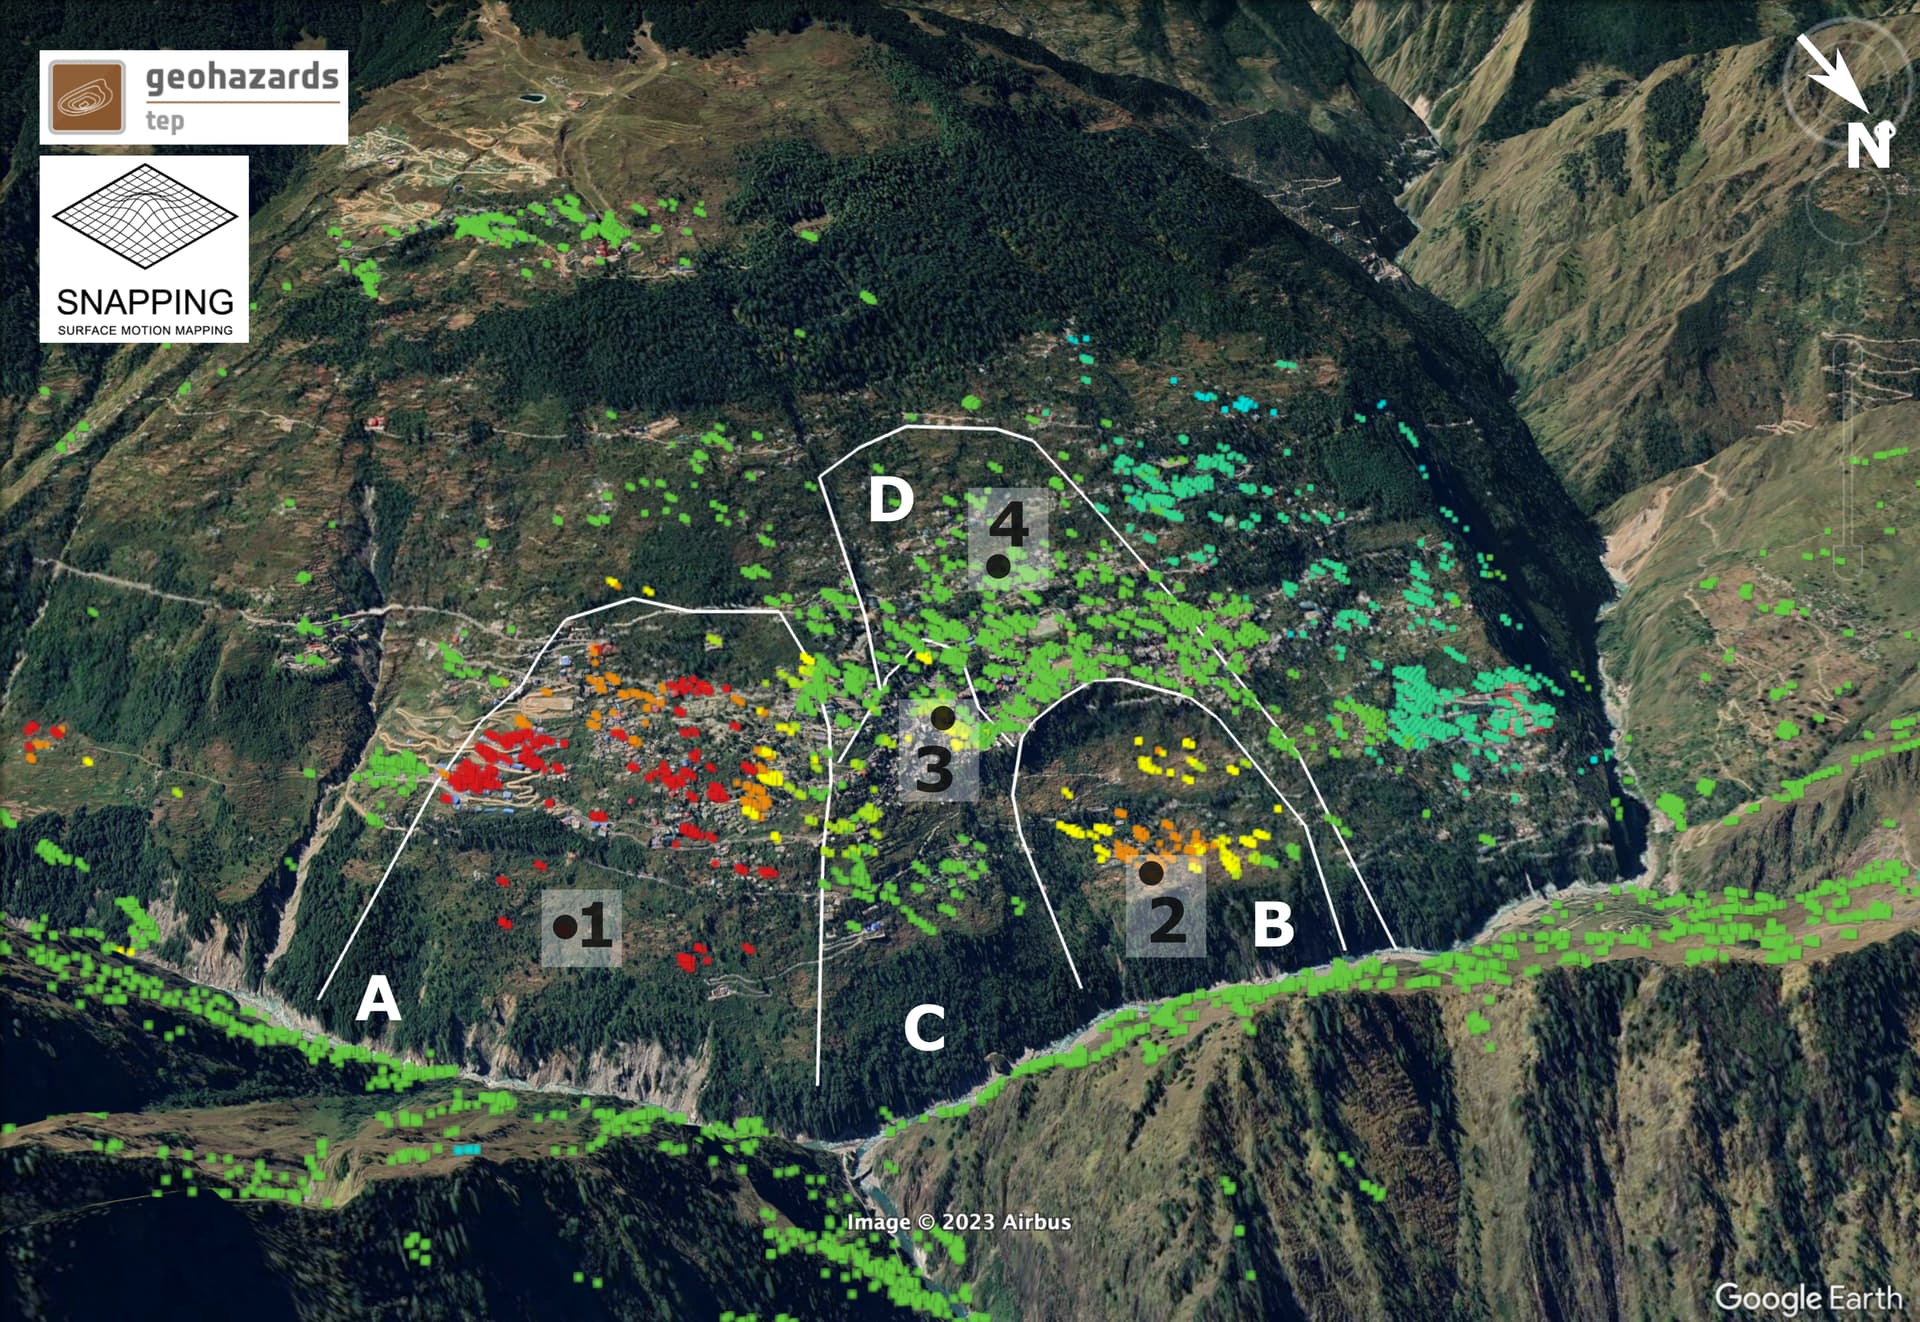
Figure 2: 3-Dimensional view of the Joshimath slope with the SNAPPING Full Resolution PSI results overlaid (background Google Earth). The location of the active units (A, B, C, D) are delimited by white lines. The location of selected PSI targets 1, 2, 3 and 4 are also indicated.
SNAPPING provides, besides average velocities, the full displacement time series (that is the evolution of motion over time) for each PSI. Examples of displacement time series are displayed on Figure 3 for four representative points (1, 2, 3 and 4) located in each spatial unit (see locations in Figure 2). Point 1 is located in the most active part showing a linear trend of -10 cm.year-1. The same behavior seems to be visible, although at a lower magnitude for Point 2 located on the less active western part of the slope. Point 3 is situated in unit C between the two active zones (units A and B) and displays a small displacement until the end of 2021. From the end of 2021 to early 2022, the displacement of this area shows an acceleration of the motion. Point 4 located in the upper Western part of the slope (unit D) shows a progressive acceleration with a motion towards the satellite. Points 1, 3 and 4 display a significant displacement in December 2022 that is consistent with the latest differential interferograms calculated by NRSC-ISRO (link to report) and with the advanced InSAR service P-SBAS (Figure 4). It is also in agreement with recent field observations mentioning the opening of fissures of several centimeters testifying of a complex sliding pattern with both vertical and horizontal deformation.
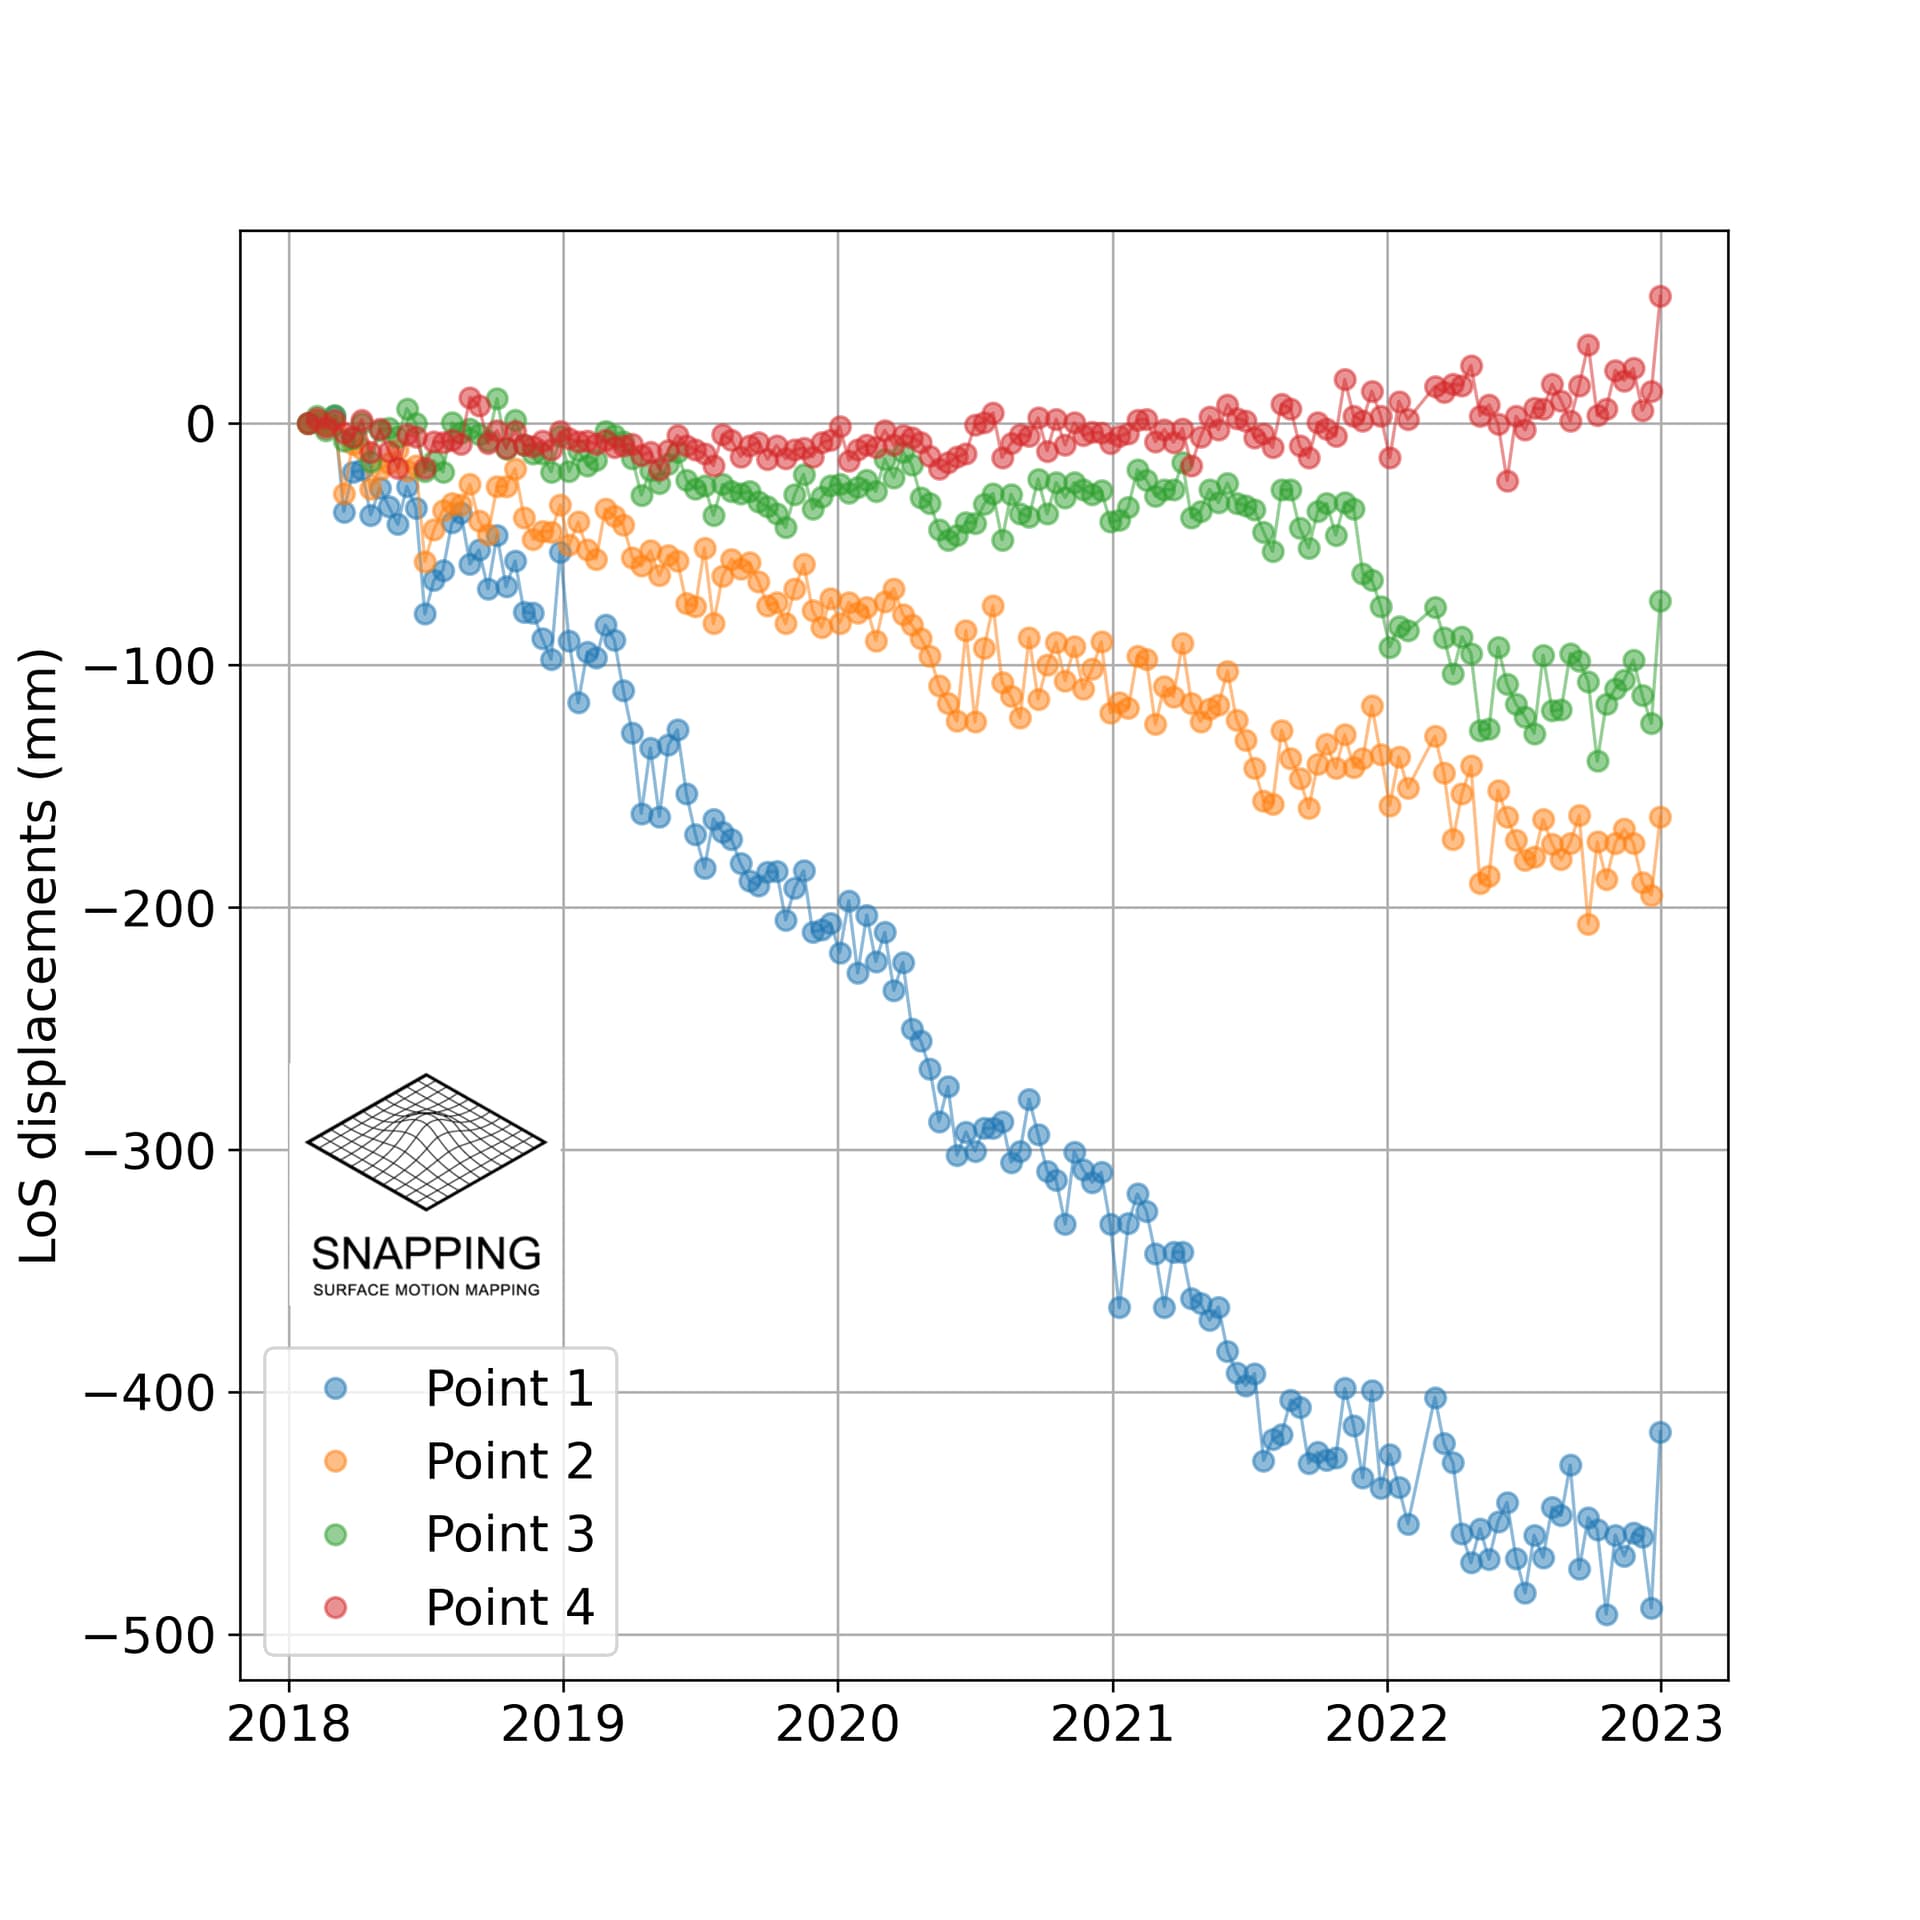
Figure 3: SNAPPING-derived LoS displacement time series on four points over the Joshimath slope for the period 01/2018-12/2022. The temporal evolution of surface motion among the various slope units follows a complex pattern, with different displacement rates.
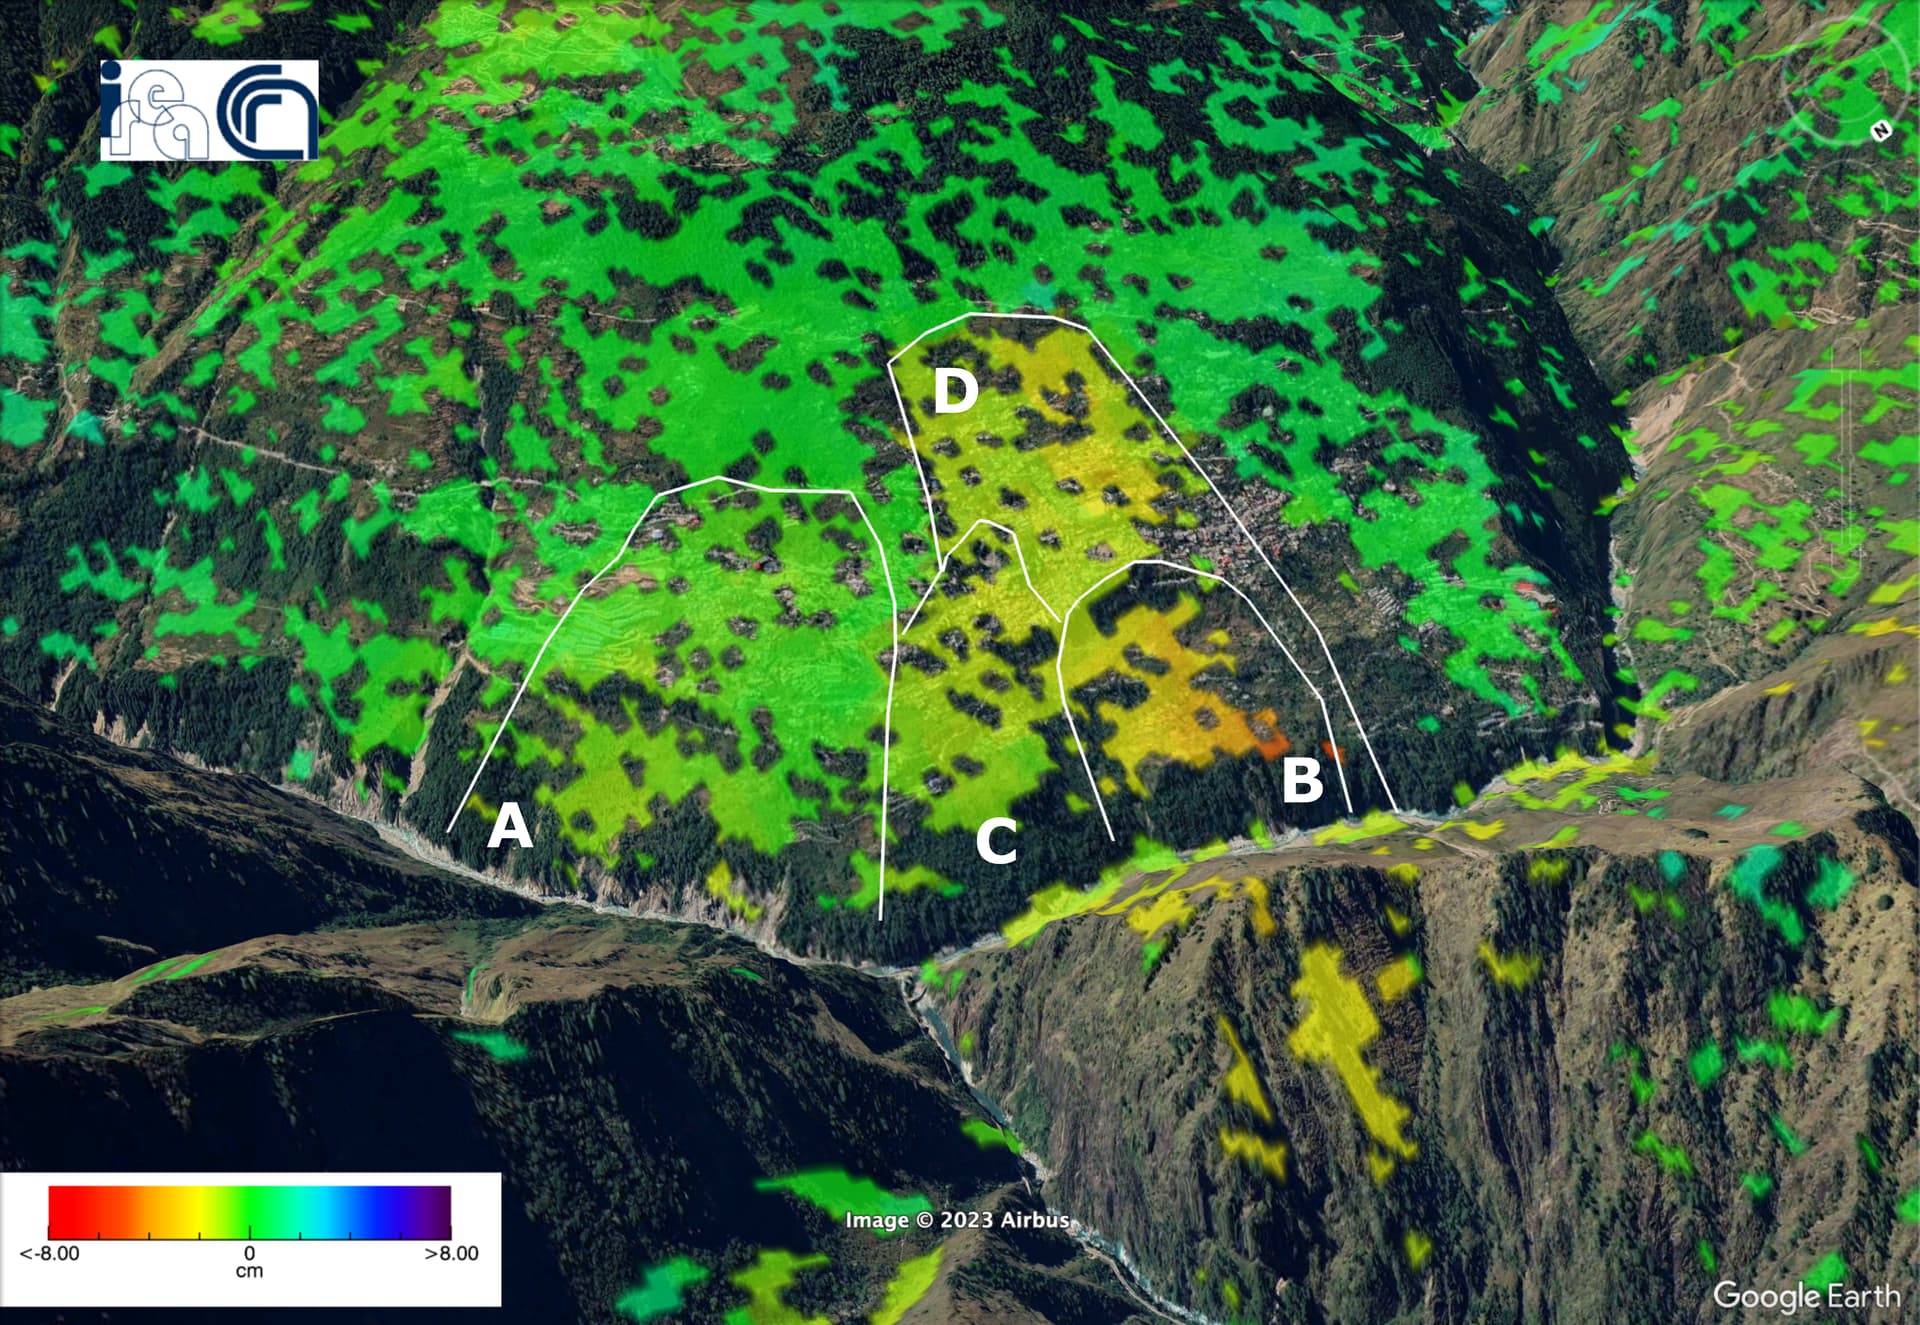
Figure 4: Unwrapped differential interferogram computed with the P-SBAS service for the Sentinel-1 ascending track 129 between the acquisitions of December 31, 2022 and January 12, 2023. Unwrapped differential interferogram provides the displacement of the ground in the LoS direction between two acquisitions. The orange and red colors indicate motion far away from the satellite corresponding to the downhill motion of the slope. Contains modified Copernicus Sentinel-1 images, 2022-2023.
This preliminary analysis indicates that satellite observations, and among them SAR time series processed with advanced InSAR services, allow to locate the active areas. These datasets are valuable for both rapid assessment of the situation, and for long-term surveys and understanding of the causes of the deformation. Indeed, more advanced analyses have to be performed to generate horizontal and vertical displacements and thus identify the absolute and complex deformation pattern. Advanced InSAR techniques can complement field instrumentation and contribute to near-real time slope movement monitoring.
The processing and preliminary analysis have been carried out by remote sensing and landslide experts of AUTh (Aristotle University of Thessaloniki) and CNRS-EOST (Centre National de la Recherche Scientifique / Ecole et Observatoire des Sciences de la Terre / Strasbourg).
Acknowledgement : Copernicus Sentinel-1 images were processed using the SNAPPING FullRes and the P-SBAS on-demand services. The work was carried out in the framework of the SAT activity with the support of the ESA Network of Resources (NoR - project 1c15aa).