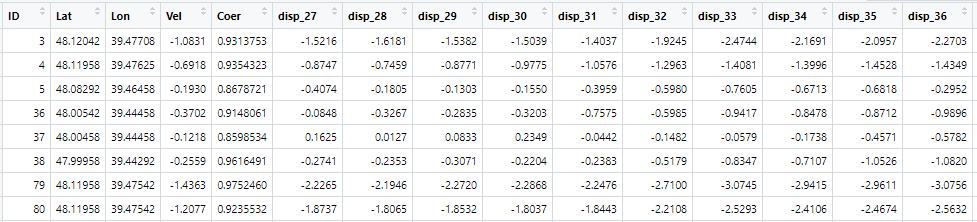
Hi there. I ran SBAS here and get a .csv table with displacement time series acquired from my 44 images for April 2017 - October 2019. All data (Vel = mean velocity cm/year for all 44 observations, each observation (disp_28, disp_29) = displacement in cm) is presented in cm. I noticed that a lot of locations have larger subsidence in the last year, 2019, when flooding of abandoned coal mines occurred in my area of interest. But I cannot fully interprete my results in terms of displacement velocity. Here I present a resulting table with only 2019 observations (starting from 28th up to 43rd). All of those are in cm. Can I sum it to get displacement in 2019? My master image was of August 2018, and probably it means that each observation (disp_28, disp_29…) means only a difference between master image and this observation. So I can only average these results, or I can sum all 2019 displacement observations? Would be grateful for any suggestions
Hi.
Displacement values are provided in cm with respect to the first acquisition (which is assumed as temporal reference and is set to zero). So every acquisition value is the actual displacement occurred at that pixel since the first used acquisition.
Velocity is the rate (linear regression) of the full time series calculated from the first to the last acquisition.
I hope this can be of help. Please, let me know if you have further questions.
2 Likes
Great! Thank you so much!
1 Like