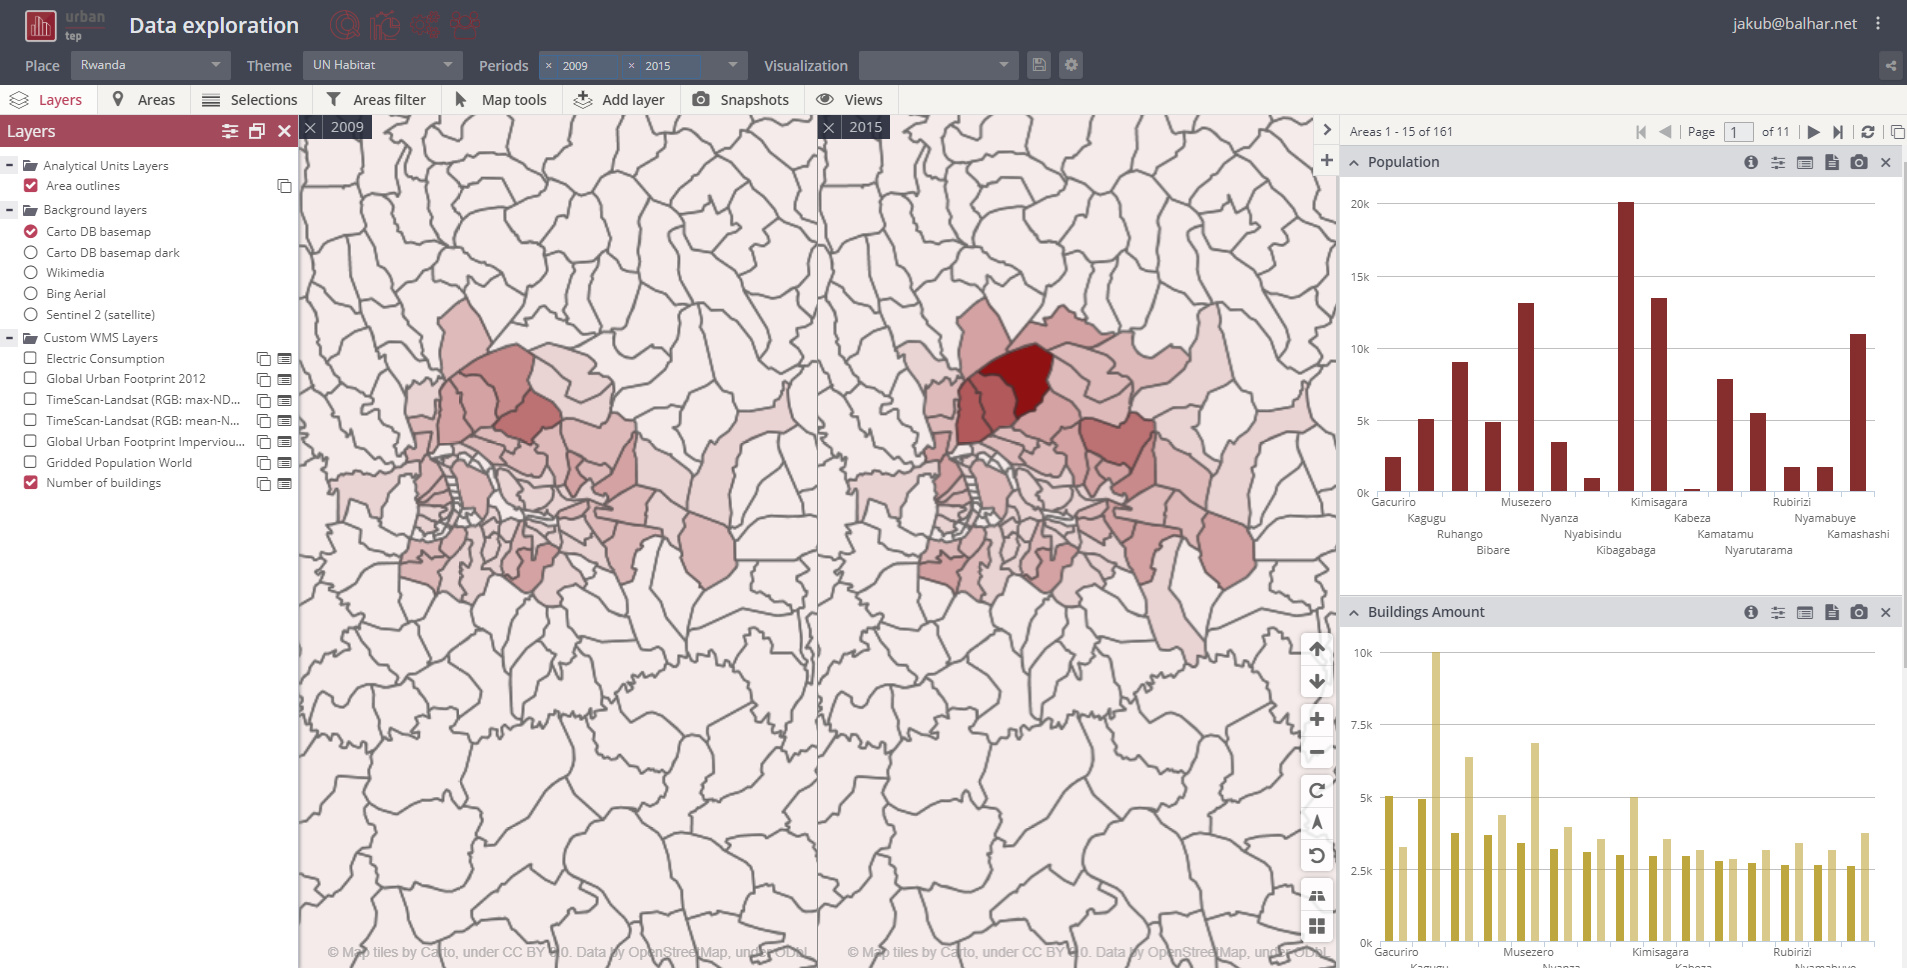
With the latest update of the Visualization And Analytics Toolbox, it is possible to create your own interactive data presentation (Example) from your own data. As a registered user, you can create one presentation for free. You can share the presentation to any community you are a member of. If you want to have a new one create a ticket in the Support system and you will get your first one for free.
To start with the creation of your own interactive data presentation go to the Administration also known as BackOffice. To learn more about how to do it visit related blog post. To learn more about the Visualization and Analytics Toolbox join VISAT community