EO Processors of the GEP allow transforming Sentinel data into geocoded image-maps in an easy and rapid fashion. This can be very useful for monitoring the asset at risk and for damage mapping. The Copernicus Sentinel missions provide guaranteed and long-term access to open and free imagery and GEP provides a set of visualisation and change detection tools. The services currently provided by GEP can support Disaster Risk Management (DRM) with services focused on the Hazard (damage mapping, hazard mapping, etc.) and others support exposure mapping (mapping the asset at risk). More basic service are focused on pre-processing and simple temporal composite products that help quickly assess the situation and characterise the region of interest or the theatre of operations. Two examples of this are the Band Combination (COMBI) service to visualize optical imagery including change detection and the COIN (Coherence and Intensity Change for Sentinel-1) service based on radar (SAR) data for regions with high cloud coverage. Colorful examples are provided to illustrate this in different themes.
The COMBI service generates full resolution images combining together the different bands from images such as from the Sentinel-2 multispectral optical sensor by creating the so called RGB (Red, Green, Blue) composite, the basic format of any color image. The user defines selects the bands to be visualized, some combination are optimal for background mapping, other are optimized for forest fire mapping or volcanic lava monitoring, etc. COMBI can also create an RGB composite where the channels visualized correspond to different Sentinel-2 observation dates. The service puts the image bands together with the same spatial reference (or geographic projection) and sampling (or resolution cell). Combining images using COMBI can support change detection analysis. More advanced users also combine channel from different sensors and can even mix optical and radar imagery.
The COIN service provides composite imagery using radar coherence and amplitude data (also known as Multi-Temporal Coherence or MTC products [1]) that are used in many activities such as for instance the Copernicus Emergency Management Services [2]. The MTC product is a powerful tool for understanding not only hazards or natural phenomena, but it can also contribute to a wide range of applications such as clear-cut monitoring, agriculture, etc. In fact, COIN results rely on the full SAR information (amplitude and interferometric phase) using a pair of images acquired with the same geometry. By bringing the interferometric phase (called coherence) the COIN products add a channel that is independent from the radar amplitude and provides colorful RGB imagery which has rich information content.
One example is the MTC products obtained over the Nile Delta with acquisitions taken 12 days apart, which produces the results below, showing: i) in red, objects with small temporal variation (high coherent); ii) in dark green, represent objects with low amplitude average and with high temporal variation (low coherent); iii) and in yellow, objects with high amplitude average and small temporal variation. This color information retrieved from the Copernicus Sentinel-1 IW SLC data, allow to visually recognized built up areas (yellow-orange), fields (green), and desert (red) and water bodies (black). Full data available here.
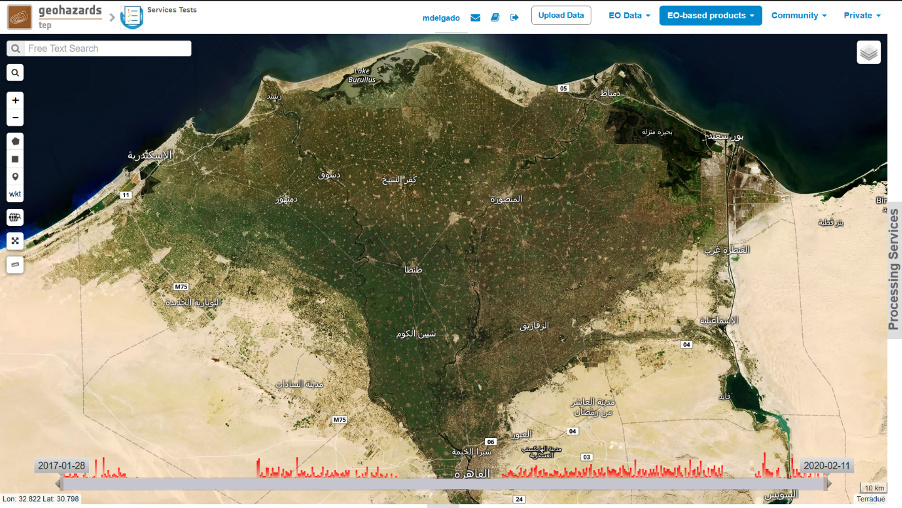
Figure 1. Natural Earth base map view on geobrowser over the Nile Delta (Egypt)
The correspondence between Figure 1 and Figure 2 is quite evident just comparing both Multi-temporal product (Figure 2) with Natural Earth base map (Figure 1).
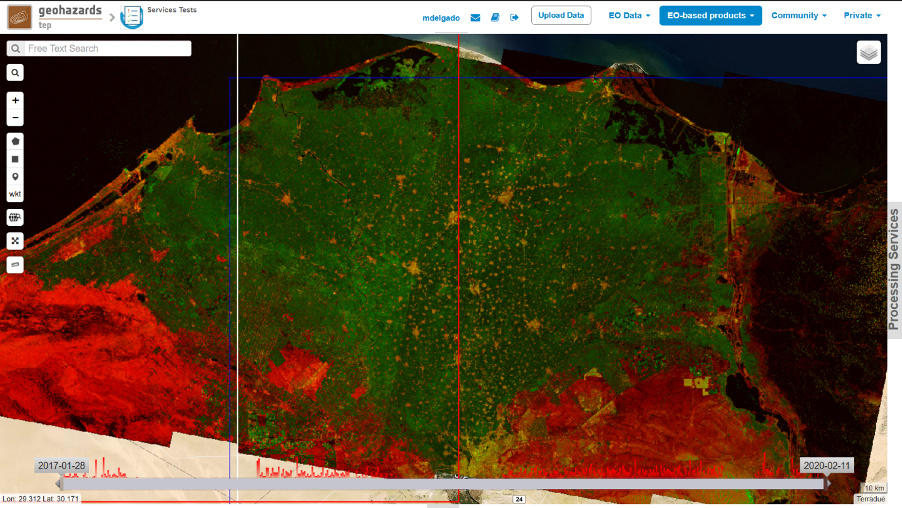
Figure 2. Muti-Temporal Coherence product over the Nile Delta computed using Copernicus Sentinel-1 (12 days temporal difference)
In this second example over the border between Iran and Iraq, the MTC product (Figure 4) allow the quick identification of agricultural areas (green) as well as Ahvaz city (in yellow-orange color), which is difficult to locate by looking only to the Natural Earth base map (Figure 3), as it seems to disappear within the desert in its surrounding (in red color in the MTC product). Additionally with the MTC areas with big changes, high decorrelation, and low signal (in black) are identified, being this information impossible to retrieve by looking at optical data. The full MTC is downloadable from here.

Figure 3. Natural Earth view over Iran/Iraq boarder viewed on GEP geobrowser
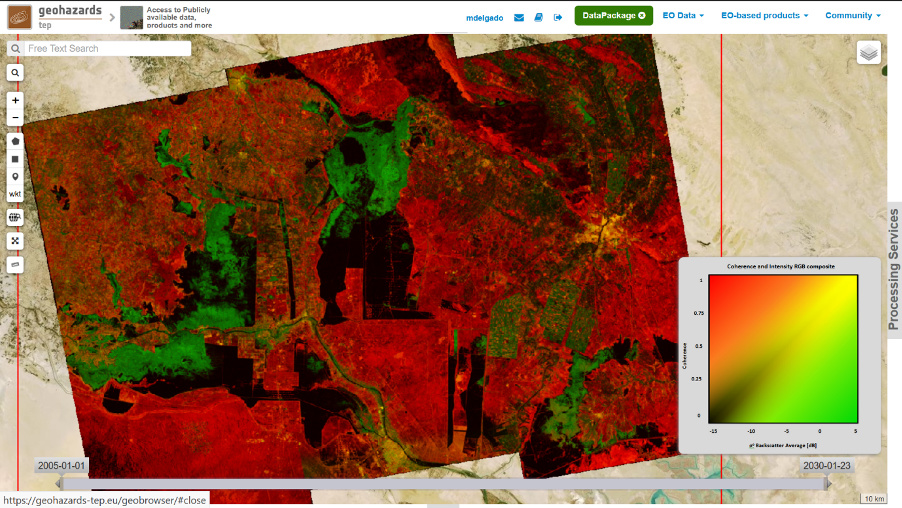
Figure 4. Muti-temporal coherence product computed with 12 days apart Copernicus Sentinel-1 data
Another example is taken from Equatorial Guinea, where the use of the Copernicus Sentinel-1 data allows the monitoring of areas normally covered by clouds. In this example, it is possible to quickly identify cities and villages (yellow-orange), the forest areas (green) and the water bodies, i.e. rivers, sea and Ocean (black). Job results can be explored here.
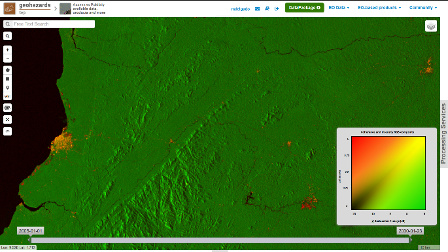
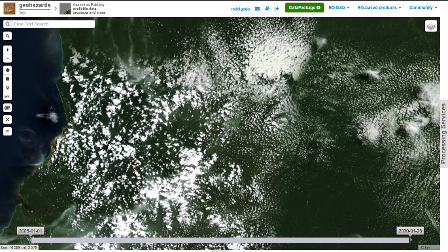
Figure 5. Multi-Temporal coherence (left) and Natural Earth (right) over Equatorial Guinea
Another example illustrated is the exploitation of the Copernicus Sentinel-2 data using the Band Combination service (COMBI) in GEP. The Band Combination service provides RGB combination from user defined bands of single or multiple EO data products. The service supports optical and SAR detected products from the following missions. Additionally and for selected sensors, visualisation enhancements are available. Its service tutorial can be found here.
The Copernicus Sentinel-2 data is also used for rapid monitoring during Disaster Charter Activations, as it is illustrated in the example below (Activation id 596) [3] for a tailings dam collapse that happened in January 2019 near Belo Horizonte (Brazil). This unfortunate event that caused several hundred of fatalities was also reported by the United Nations [4]. Get the full resolution products from here.
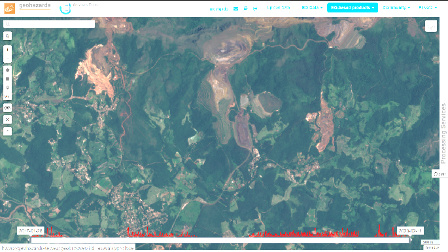
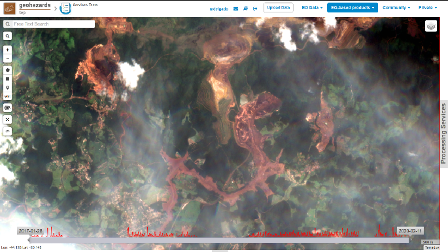
Figure 6. False RGB of Copernicus Sentinel-2 (bands 4,3,2) showing the dam collapse in Brazil that occurred last January 2019
Some more examples of band combinations can be found here below, such as Natural color, False color composites which enhance healthy vegetation, water, land, making usage of multi-spectral bands of the Copernicus Sentinel-2 sensor.
Background:
The COIN service is based on the Sentinel Application Platform software (SNAP) and provides geocoded composites of coherence and amplitude images from a pair of Sentinel-1 TOPSAR IW data pairs. SNAP is a common architecture for all Sentinel Toolboxes, which is ideal for Earth Observation processing and analysis. The tutorial can be found here.
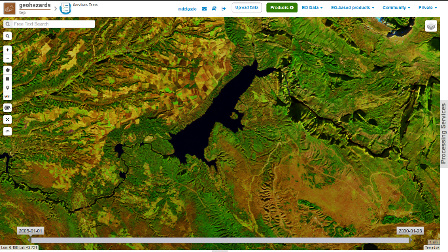
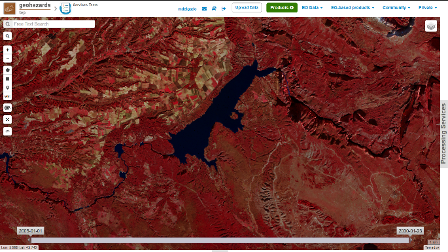
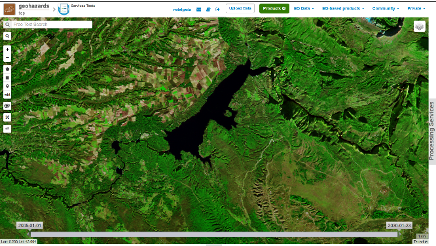
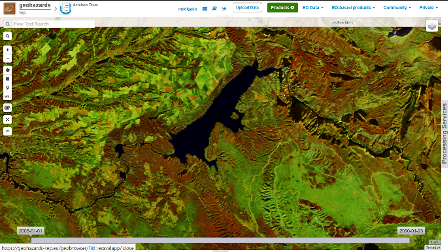
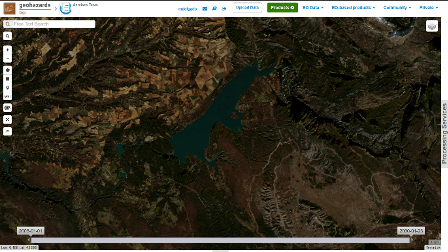
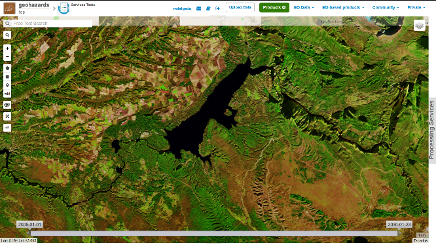
Figure 7. Multi RGB color composites using Copernicus Sentinel-2
The Copernicus Sentinel missions exploited by the services offered by the Geohazards TEP, allow an easy and systematic data processing of any part of the Globe in almost near-real time, being desirable and sometimes necessary for monitoring and surveillance activities of remote regions, not only for monitoring of natural hazards but also for land applications as it has been illustrated above. More examples on the usage of COMBI service for visualization of satellite data can be found here.
REFERENCES
- [1] ASF ALASKA (Accessed on 2nd May 2020). Url: How to Create an RGB Composite from Multi-Temporal Sentinel-1 Data | ASF
- [2] Copernicus Emergency Management Services. European Commission. (Accessed on 2nd May 2020). Url: JRC Publications Repository
- [3] International Disaster Charter. Charter Activation 596. (Accessed on 3rd May 2020). Url: Dam collapse in Brazil - Activations - International Disasters Charter
- [4] United Nations. (Accessed on 3rd May 2020). Url: International Charter activated for dam collapse in Brazil | UN-SPIDER Knowledge Portal