Hi everybody,
I processed two different data sets (Ascending and Descending), you can see the results ans scale bars here, this ascending dataset

this descending dataset
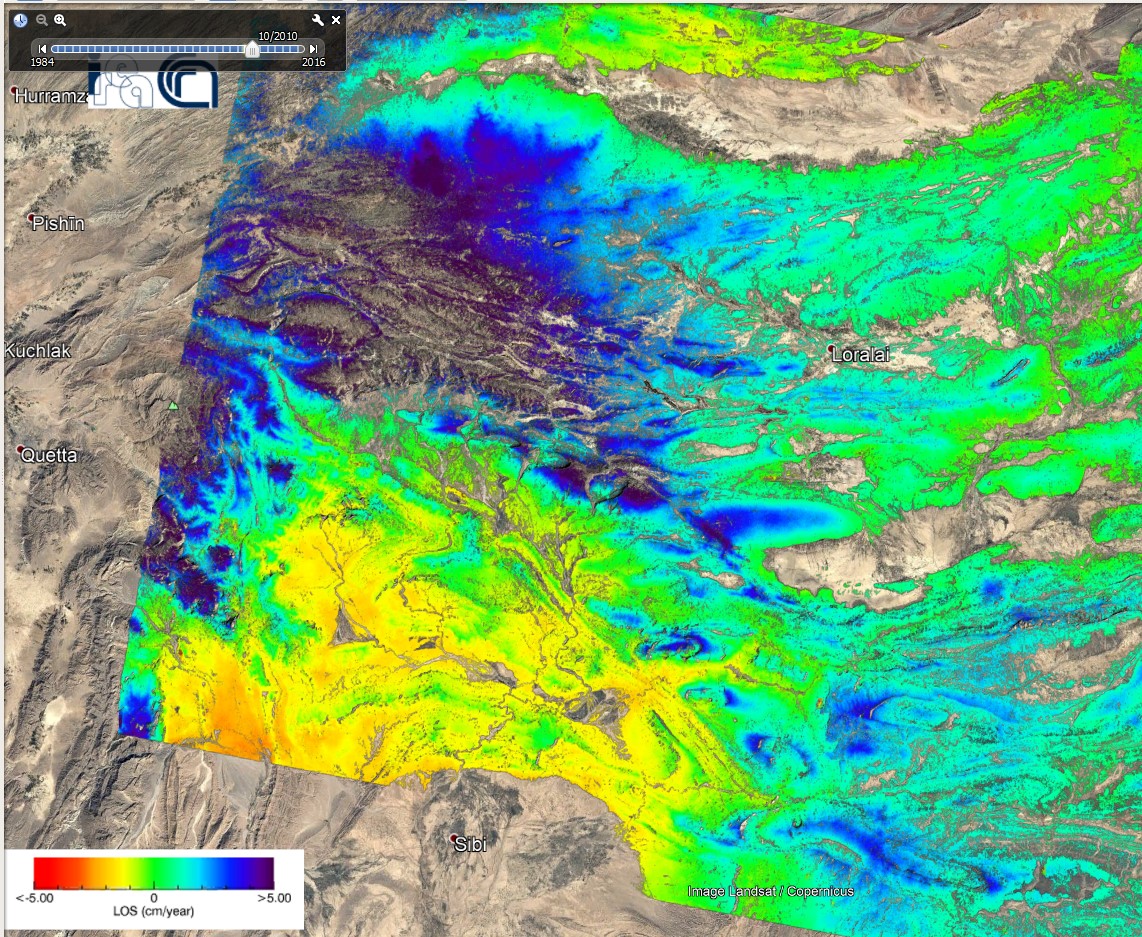
So as you can see here both of them have same color scale bar, my question is how I can interpret these pictures, positive value indicate towards satellite/uplift or vice versa in both Ascending and Descending?
Cheers