Several land subsidence studies correlate InSAR outputs with geospatial layers depicting surface/bedrock geology, other hazard factors or elements at risk (e.g. topographic and cadastral maps). However, still limited is the body of literature attempting to generate InSAR-based value-added products such as risk maps identifying the distribution of urban infrastructure that might potentially be affected by subsidence-induced structural damage.
The highest risk for buildings to be impacted by fracturing/cracking and faulting typically occurs in areas affected by sharp spatial differences in land subsidence magnitude, and damage severity depends on many subsidence-related intensity parameters (e.g. total and differential settlement affecting the structure, angular distortions and relative rotations), in addition to building construction year, type, characteristics and maintenance state of superstructures and foundations.
To contribute to this research direction, we developed a methodology to exploit InSAR outputs to generate risk maps of surface cracking and faulting that might develop in urban infrastructure affected by land subsidence (Fig.1).
The methodology is based on the use of a risk matrix, combining information on InSAR-derived hazard information with distribution of the elements at risk (urban properties).
Hazard information is based on:
- The land settlement gradient observed between adjacent locations, which is quantified through the so-called ‘angular distortion’ ( β ). This enables the identification of hazard categories with increasing probability of occurrence of the impacting phenomenon, e.g.: low ( β ≤ 1/3000), medium (1/3000 < β ≤ 1/1500), high (1/1500 < β ≤ 1/500) and very high ( β > 1/500).
- The spatial change rate of the horizontal displacement, which provides the ‘horizontal strain’ ( ε ). The presence of significant horizontal strain (| ε | ≥ 0.03%), either positive (tensile strain, hogging) or negative (compressive strain, sagging), triggers a one-level increment in the hazard category.
The spatial density ( δP ) of the urban properties provides a proxy for the potential impact that surface faulting could cause on infrastructure, e.g.: low ( δP ≤ 2000 prop./km2), medium (2000 < δP ≤ 5000 prop./km2), high ( δP > 5000 prop./km2).
Risk categories in the output maps include: R0 - Very low, R1 - Low, R2 - Medium, R3 - High, R4 - Very high.
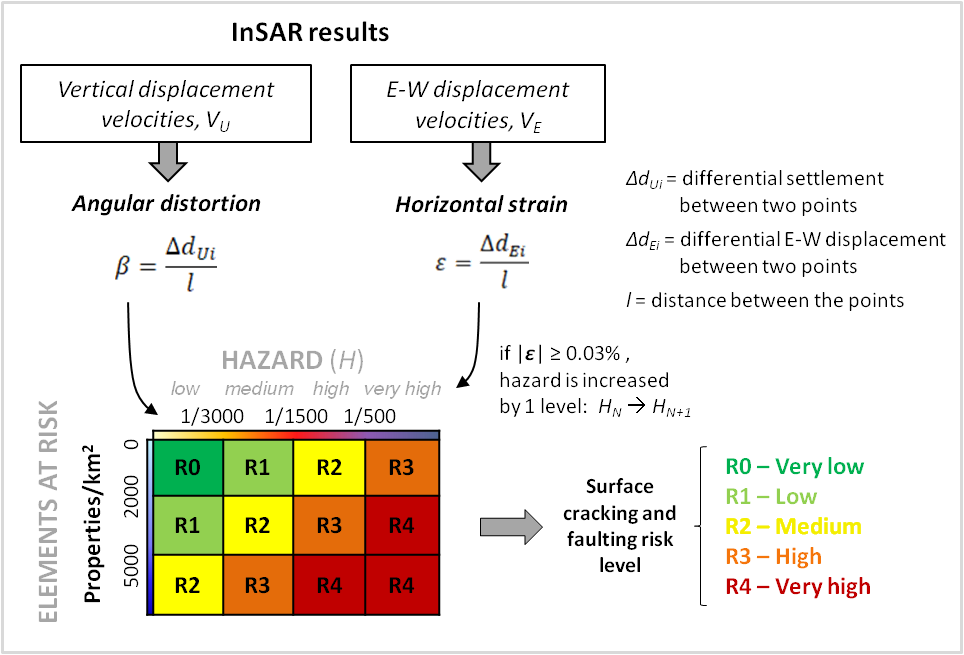
Figure 1 : Simplified workflow of the developed InSAR-based methodology for surface cracking and faulting risk assessment in land subsiding urban areas. Source: [full paper #1] & [full paper #2] .
To test and fine-tune this methodology, we focused on Central Mexico, where land subsidence due to groundwater resource overexploitation is a pressing issue affecting many urban centers and expanding metropolises. Several Sentinel-1 image stacks were processed using the Parallel-Small Baseline Subset (P-SBAS) advanced InSAR workflow within the GEP, and were used as the lead inputs for the surface faulting risk assessment.
HOTSPOT #1: Mexico City
Mexico City Metropolitan Area is among the most populated and fastest sinking metropolises globally.
P-SBAS results highlight vertical displacement rates as high as −39 cm/year in 2014–2020, with peaks at Iztapalapa, Nezahualcóyotl, Gustavo A. Madero and Venustiano Carranza (Fig.2a). Compaction of the lacustrine clay deposits composing the aquitard is confirmed as the lead factor controlling land subsidence, with main volcanic edifices marking ground stability “islets” inside the main subsidence bowls.
The surface faulting risk analysis is carried out at the scale of the urban basic geostatistical areas (AGEBs) as defined by the Mexican National Institute of Statistics, Geography and Informatics (INEGI). These are areas occupied by a set of blocks delimited by streets/avenues, with mainly residential, industrial, public or commercial use. Our analysis reveals that over 457,000 properties in the Metropolitan Area are in zones at high to very high surface faulting risk, mainly in Iztapalapa, Tláhuac, Chimalhuacán and Chalco, and the population living in those properties amounts to 1.5 million inhabitants (Fig.2b-d).
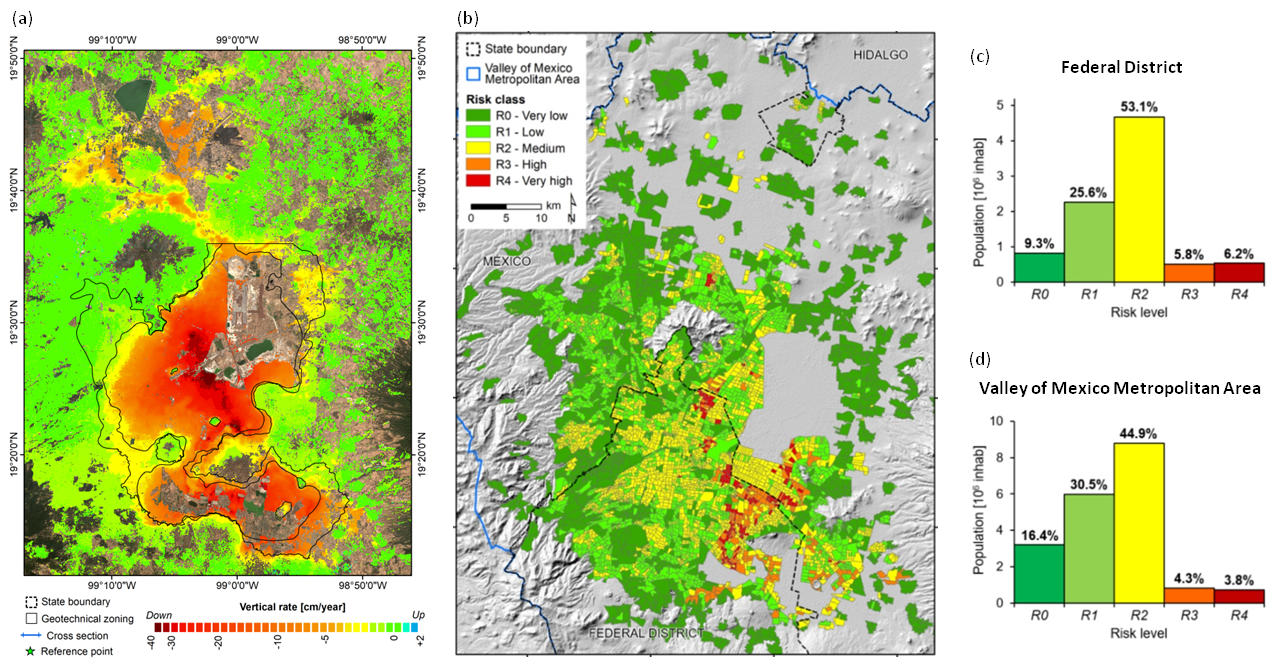
Figure 2 : (a) Vertical displacement velocity in Mexico City in 2017–2019 from P-SBAS InSAR processing of Sentinel-1 data, with indication of geotechnical zone boundaries, overlapped onto Sentinel-2 data; (b) Subsidence-induced surface faulting risk zoning in the urban AGEBs (basic geostatistical areas), overlapped onto shaded relief of SRTM DEM; and statistics on affected population for the different risk levels within (c) the Federal District and (d) the Valley of Mexico Metropolitan Area. Source: [full paper #1] .
HOTSPOT #2: Aguascalientes Valley
In the state of Aguascalientes, a structurally-controlled fast subsidence process affects the namesake valley and capital city, where groundwater resources are largely exploited to sustain public, agricultural and industrial water needs.
P-SBAS analysis highlights up to −12 cm/year vertical rates (Fig.3a) in 2015–2020, and unveils previously unknown E-W deformation affecting two N-S oriented bands within the valley, with up to ±3 cm/year in 2015–2020 towards its center (Fig.3b). This produces zones of sagging and hogging with horizontal strain of up to 0.05–0.1% (Fig.3c).
The surface faulting risk analysis reveals that 6% urban areas are at high to very-high risk in 2015–2020 (Fig.3d), i.e. ~25,600 properties inhabited by ~85,200 people. High risk zones are mainly aligned with the N-S oriented structural features (e.g. Oriente fault), across which the greatest differential displacements are observed.

Figure 3 : (a) Vertical and (b) east-west displacement velocity in 2015–2020, derived by combining Sentinel-1 P-SBAS ascending and descending results; (c) sediment thickness (HC), piezometric level change in 2000–2014 (Δhi), vertical (VU) and east-west (VE) velocity along cross section A-A’, with indication of zones of hogging and sagging; (d) surface faulting risk map based on Sentinel-1 2015–2020 data. Data in (a,b,d) are overlapped onto shaded relief of SRTM DEM. Source: [full paper #2] .
HOTSPOT #3: Morelia
The Metropolitan Area of Morelia is a rapidly expanding metropolis where population doubled over the last 30 years and a subsidence-creep-fault process has been identified.
P-SBAS results highlight −9 cm/year vertical displacement rates (Fig.4a) and up to ±1.7 cm/year E-W rates, and confirm that subsidence is structurally-controlled by the main normal faults within the Cuitzeo half-graben. Differential sinking and ground discontinuities are aligned with buried tectonic faults and contrasting compressible sediment thickness. Non-linearly deforming subsidence bowls develop around extraction wells in both old and newly urbanized sectors of the ZMM.
One of them is the densely populated social housing neighborhood of Villas del Pedregal (Fig.4b-e), where a 4 km2 rapidly subsiding bowl formed as building lots were progressively completed and sold, and new groundwater wells registered. With angular distortions due to the differential subsidence reaching 0.12% (Fig.4d), new buildings and roads are exposed to fracturing and surface faulting risk of comparable level as the city historic building blocks located along the main faults (Fig.5c,e).
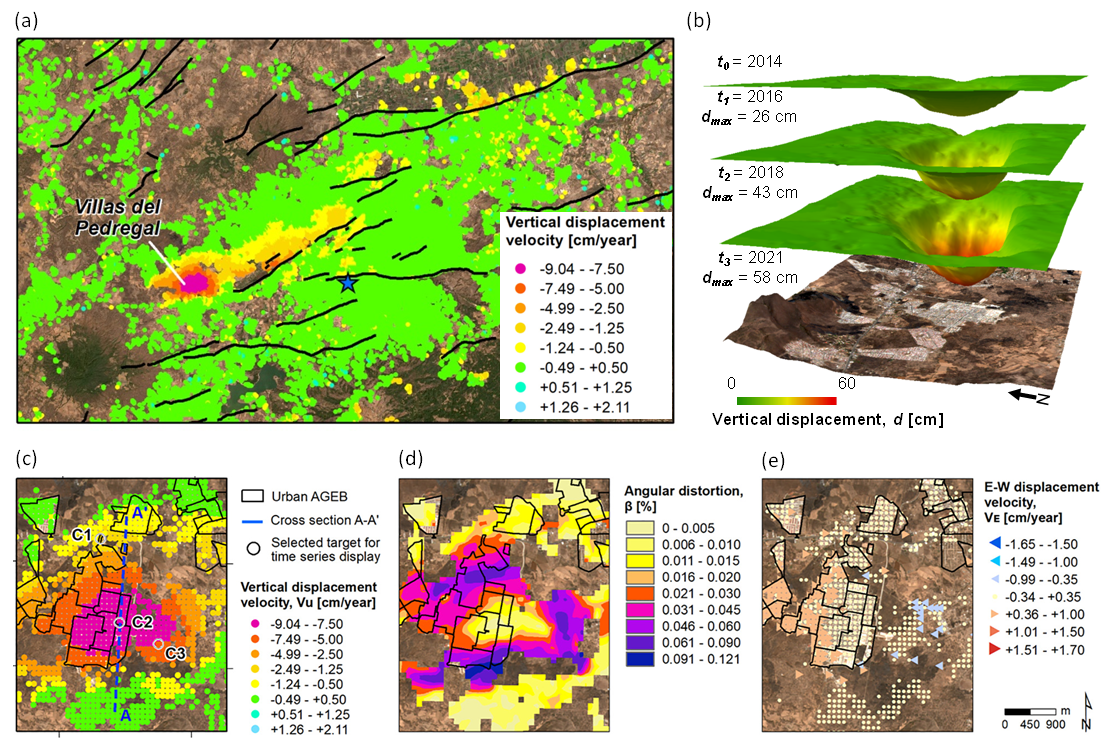
Figure 4 : (a) Vertical displacement velocity in 2014–2021 in Morelia, estimated via Sentinel-1 P-SBAS InSAR analysis. Detailed view of the Villas del Pedregal neighborhood, where a subsidence bowl is clearly identified through: (b) 3D time-lapse of vertical displacement, (c) vertical displacement velocity, (d) angular distortions and (e) E-W displacement velocity. Maps are overlapped onto Sentinel-2 data. Source: [full paper #3] .
Compared to the Mexico City investigation (see hotspot#1), the surface faulting risk analysis in Morelia is spatially pushed from the level of urban AGEBs (Fig.5a) down to single urban blocks (Fig.5b), thus further detailing the location of the most affected properties and refining the analysis (Fig.5c-f). The risk assessment at urban blocks level reveals that over 8,700 properties and 17,500 inhabitants are in high and very high risk zones.
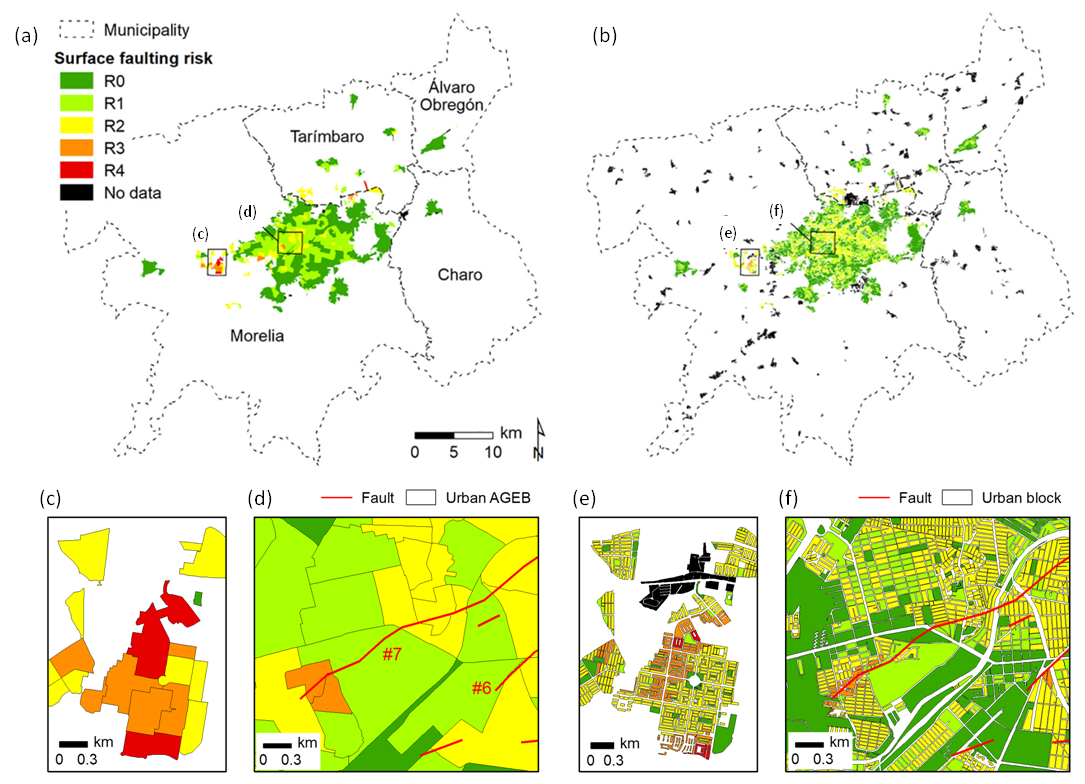
Figure 5 : Surface faulting risk assessment in (a,b) the Metropolitan Area of Morelia in 2014–2021, (c,e) La Hacienda, Del Bosque and Villas del Pedregal neighborhoods and (d,f) the city centre of Morelia. Risk zoning at (a,c,d) urban AGEB and (b,e,f) urban block level. Notation: #6 Central Camionera fault, #7 La Colina fault. No data indicate polygons for which no information on properties was available from the 2020 census. Urban AGEB and block dataset from INEGI. Source: [full paper #3] .
Conclusions and impact
InSAR results and the derived risk maps prove valuable not only to constrain the land deformation process at these hotspots, but also to quantify properties at risk and the population that might be impacted. These risk maps are prototype products that may provide essential knowledge-base for stakeholders for geological risk management and urban planning, as well as for policy makers and regulators to optimize groundwater resource management, and accommodate existing and future water demands.
In addition to act as a static product providing a risk assessment for a given time period (depending on the input InSAR datasets used), these maps can become a dynamic product as they can be updated when new InSAR data are made available, to provide an up-to-date account of the evolution of the risk scenario.
Dissemination
The full papers presenting the three case studies can be accessed at:
- HOTSPOT#1: Present-day land subsidence rates, surface faulting hazard and risk in Mexico City with 2014–2020 Sentinel-1 IW InSAR
- HOTSPOT #2: Satellite InSAR survey of structurally-controlled land subsidence due to groundwater exploitation in the Aguascalientes Valley, Mexico
- HOTSPOT #3: Urban growth and land subsidence: Multi-decadal investigation using human settlement data and satellite InSAR in Morelia, Mexico
This work has been recently presented via a solicited talk at the EGU General Assembly 2022, during the thematic session “ NH6.5 - Interferometric Synthetic Aperture Radar added value products for Natural & Anthropogenic hazard assessment at local, regional and national scale ”.
Further dissemination has been made during the ESA Living Planet Symposium (LPS22), as part of the presentations in the sessions “ A7.05.1 InSAR for the groundwater management ” and “ B4.01.1 Heritage Missions and Long Time Data Series – 1 ”.
Acknowledgement : Sentinel-1 data were processed using the P-SBAS on-demand service, developed and integrated by CNR-IREA in the Geohazards TEP. This work was carried out in the framework of the GEP Early Adopters Programme and the Geohazards Lab initiative, the latter developed under the CEOS Working Group on Disasters.